


Description
Forecasts a variable by fitting a straight line to the data. It is a model that relates a response variable Y to an input variable x by the equation
Y=ax+b
The quantities a (slope) and b (intercept) are arguments of the regression model. The fitting is done using the ordinary least squares method.
Syntax
FORECAST_LINEAR(Source Metric [, Ranking Dimension] [, Alternate Metric])
Source Metricis the data source on which the linear regression is computed, and must be a metric with data points as an expression of Integer or number type. This metric must include the same dimension that is used in theRanking Dimensionargument.Ranking Dimensionis the dimension by which the regression is computed. If left undefined, the ranking dimension defaults to a Calendar Dimension fromSource Metric. IfSource Metricis defined on multiple Calendar Dimensions, you must define which dimension to use. If you want to use a dimension outside of time, you must define it here.-
Alternate Metricis an optional argument that allows you to forecastSource Metricbased on another metric.Alternate Metricmust be another metric with the exact same dimensionality asSource Metric
The last 2 arguments, Ranking Dimension and Alternate Metric are optional.
Return type
All the time series cells will be filled by an integer or decimal value starting from the first empty cell until the last value of the Ranking Dimension (as it is sorted).
Note: If the regression is against an Alternate Metric, the forecast will only compute a value on non-empty X values.
How the slope is calculated across dimensions
The quantities a (slope) and b (intercept) are arguments of the regression model. The fitting is done using the ordinary least squares method. The slope a and intercept b are computed on all the dimensions that are not designed as the Ranking Dimension. This calculation will be performed on all items within the dimensions outside of the Ranking Dimension.
It means that when performing a linear regression on time on a metric based on Month and Country, the resulting metric will have a different equation on all country items.
For example, let's say you have a metric with Month, Country, and Product, and you use Month as the Ranking Dimension the linear regression would be performed for each item in the Country and Product dimensions.
Note: If Source Metric has empty values, they won't be taken into account to compute a and b.
Note: If the Source Metric has only one data point, the linear regression will return a constant function equal to the only available data point
Examples
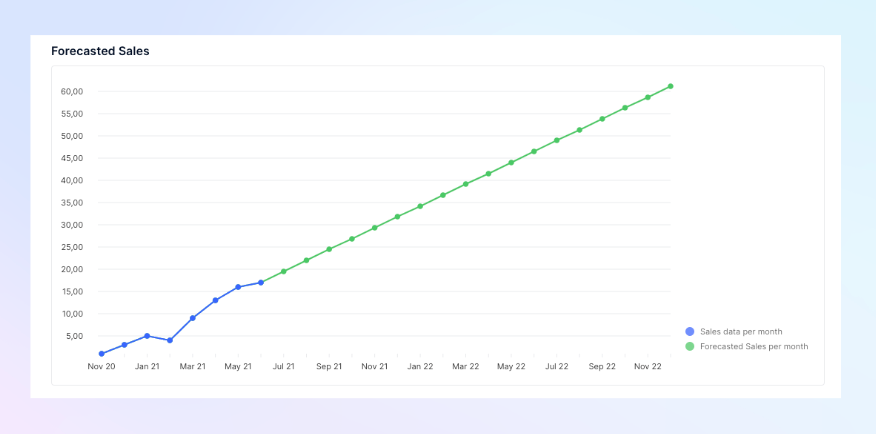
Metric Sales defined on 1 Dimension
| Month | Nov | Dec | Jan | Feb | Mar | Apr | May | Jun | Jul | Aug | Sep | Oct | Nov | Dec |
|---|---|---|---|---|---|---|---|---|---|---|---|---|---|---|
| Sales | 1 | 3 | 5 | 4 | 9 | 13 | 16 | 17 |
Forecasted Sales =FORECAST_LINEAR('Sales','Month’)
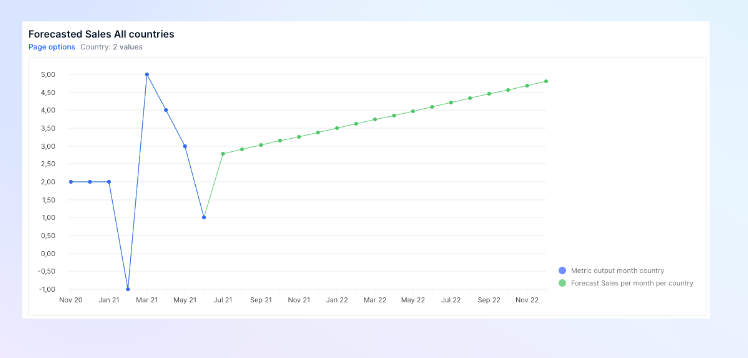
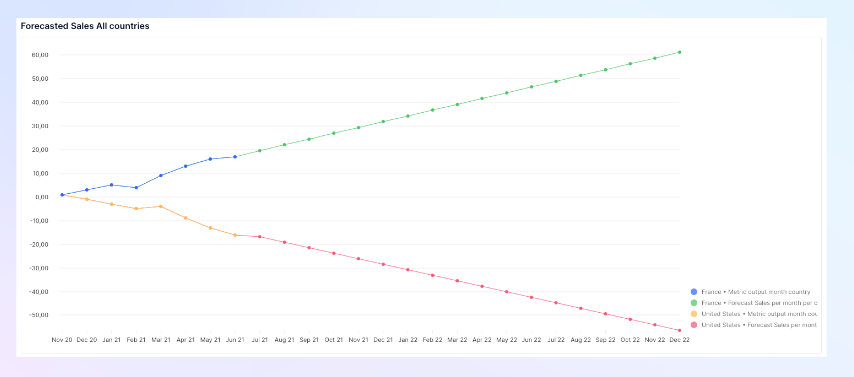
Metric Sales defined on 2 Dimensions
| Month | Nov | Dec | Jan | Feb | Mar | Apr | May | Jun | Nov | Dec | Jan | Feb | Mar | Apr | May | Jun |
|---|---|---|---|---|---|---|---|---|---|---|---|---|---|---|---|---|
| Country | FR | FR | FR | FR | FR | FR | FR | FR | US | US | US | US | US | US | US | US |
| Sales | 1 | 3 | 5 | 4 | 9 | 13 | 16 | 17 | 1 | -1 | -3 | -5 | -4 | -9 | -13 | -16 |
Forecasted Sales =FORECAST_LINEAR('Sales','Month’) aggregated on Countries
Forecasted Sales =FORECAST_LINEAR('Sales','Month’) not aggregated on Countries
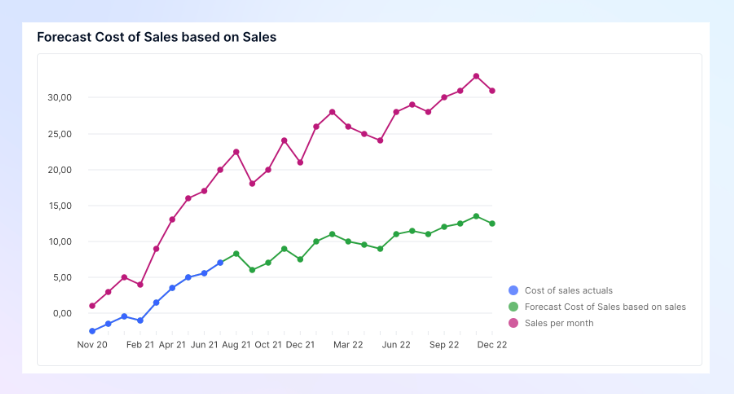
Metric Cost of sales against Metric Sales.
| Sales | 1 | 3 | 5 | 4 | 9 | 13 | 16 | 17 | 20 | 4 | 5 | 6 | 7 | 8 | 9 | 10 |
|---|---|---|---|---|---|---|---|---|---|---|---|---|---|---|---|---|
| Cost of sales | -2.5 | -1.5 | -0.5 | -1 | 1.5 | 3.5 | 5 | 5.5 | 7 |
Forecasted Salary =FORECAST_LINEAR('Cost of sales actuals’,'Month','Sales per month')
References
https://www.sciencedirect.com/topics/mathematics/simple-linear-regression
More of a hands-on learner?
Talk to your Customer Success Manager about downloading the Functions and Modifiers in Pigment Application into your workspace. It includes examples of every formula and modifier in Pigment!
