The Pivot functionality allows you to change your view and configure what is listed in the Pages, columns, and rows of a grid. This feature is available for Tables, Lists and Metrics.
Table of Contents
Watch this video to find out more about how to use Pivot in Pigment.
What does Pivot do?
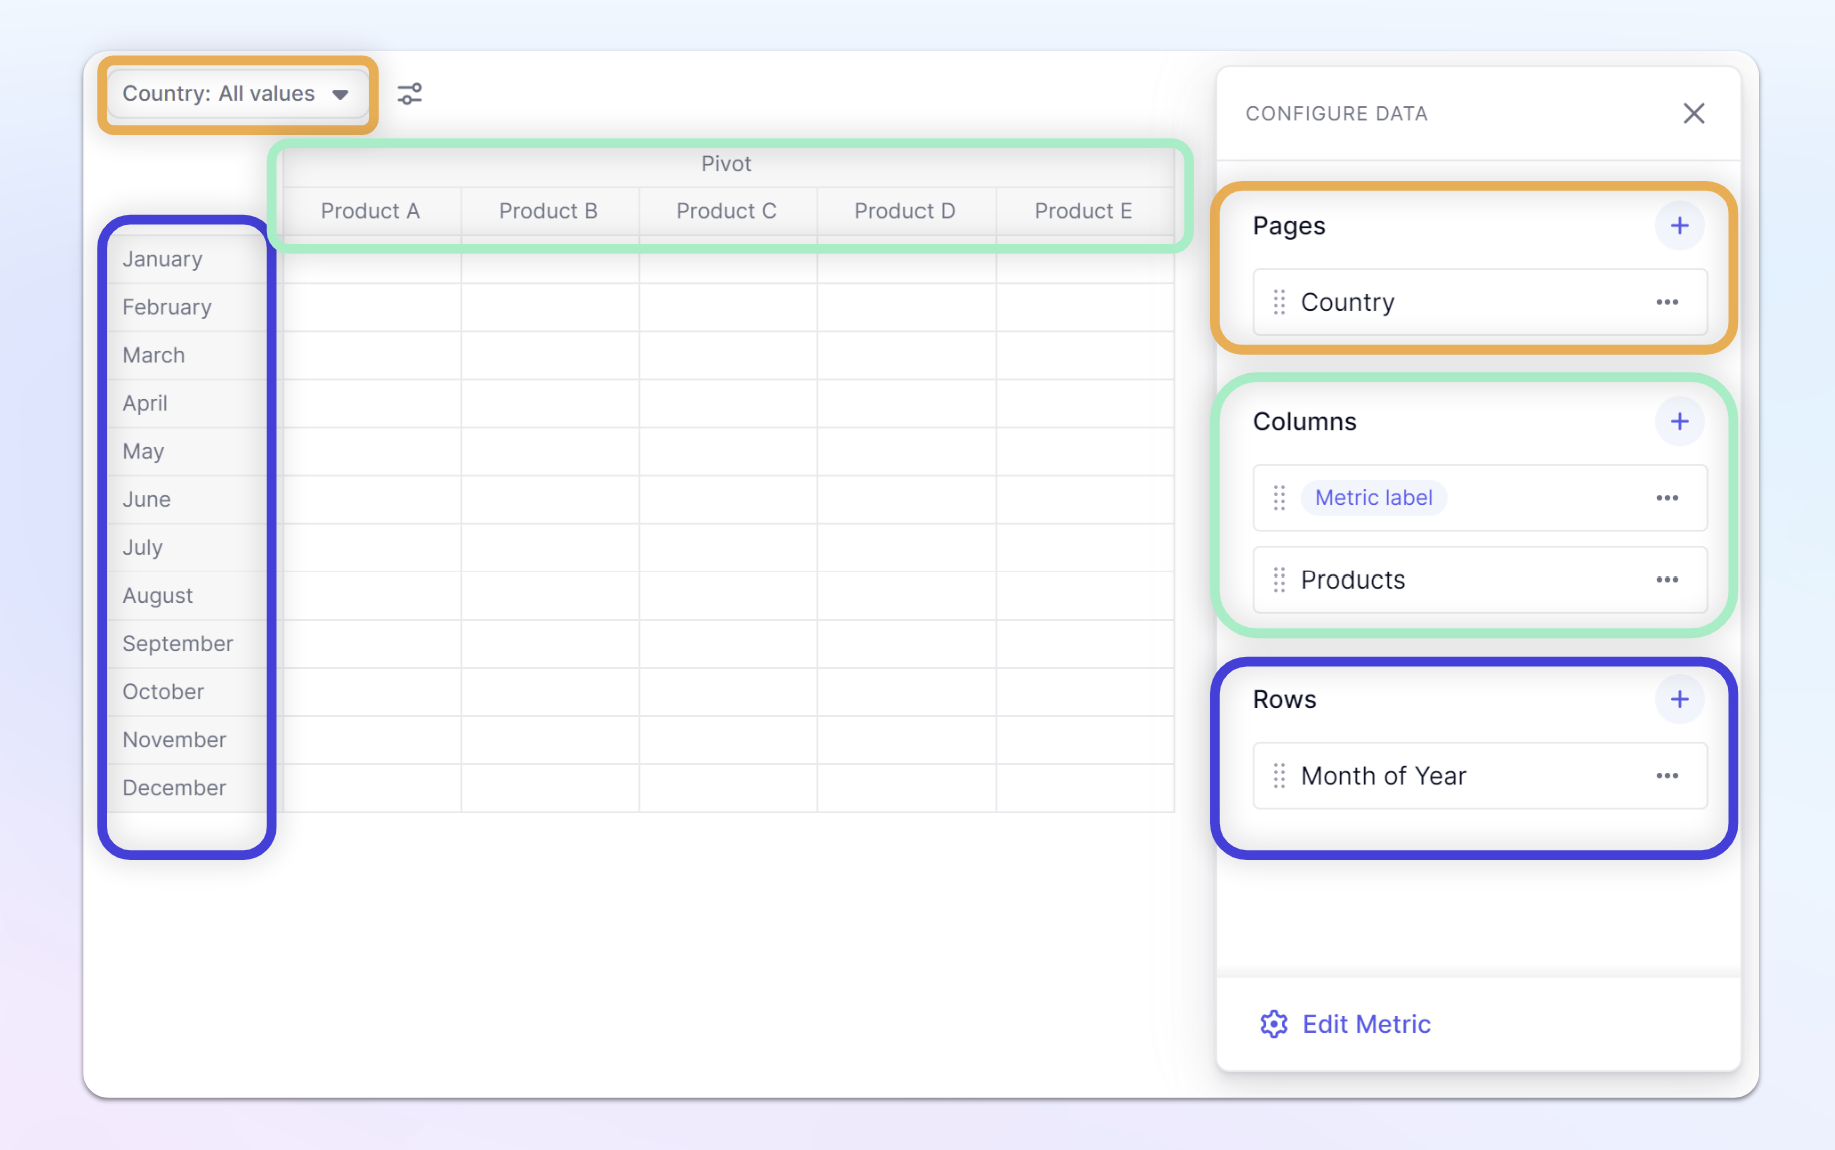
Pivot allows you to change the position of dimensions and metrics in Table and Metric views. There are three different positions, Pages, Columns, and Rows. The image below shows a metric, orange highlights the page selection. green shows columns and rows are highlighted in blue. Once you adjust the view to the way you want it, you can save this view to be used in Grids, KPIs, or Charts for Boards.
How to access Pivot?
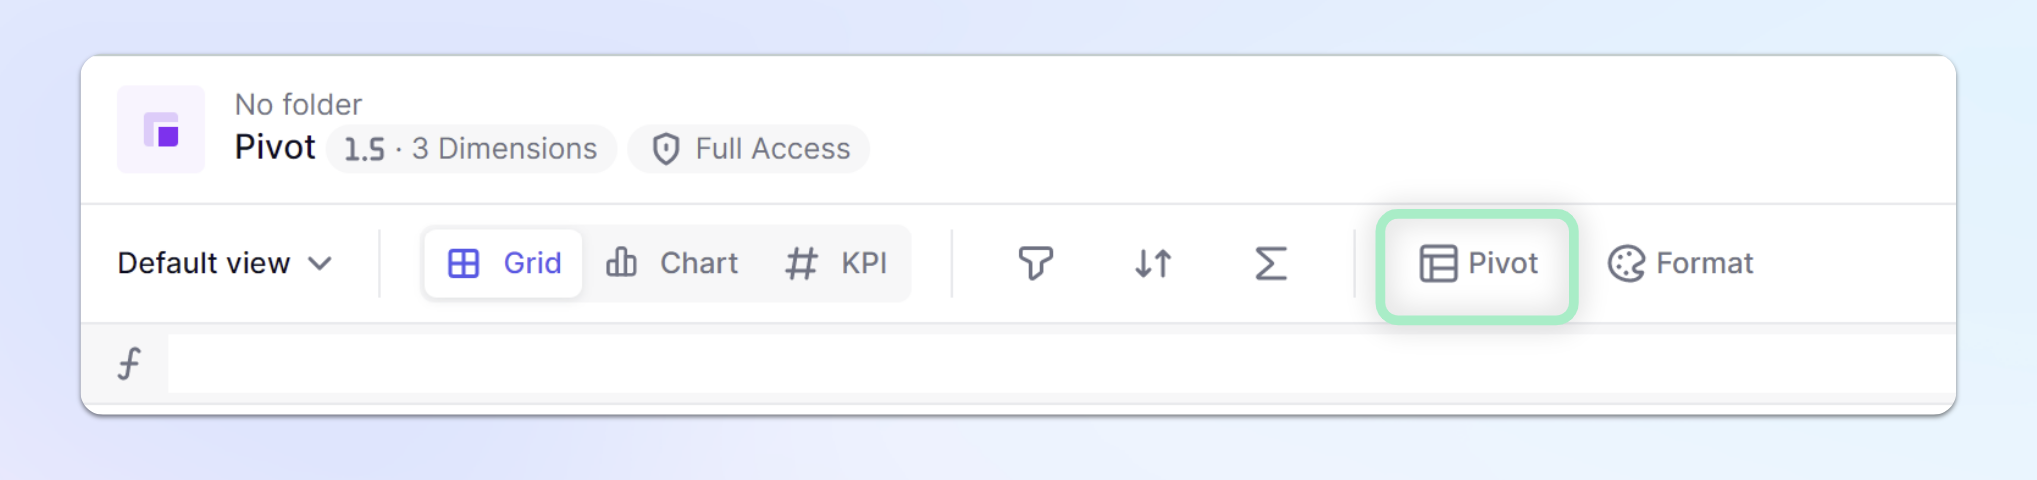
In the header of Metrics and Tables, you can access the Pivot panel by clicking on the Pivot icon. If you want to access the Pivot functionality for a grid on a Board, you must expand it.
Moving Dimensions
You can drag and drop dimensions into the different positions to adjust your view. You can also use the + sign next to each position to be able to add a dimension.
Here are some general notes and tips
- If you want to review one item of a dimension at a time or a total, set that dimension as a Page. For example, if you analyze your data one product at a time, you would set the Product dimension as a page selector.
- Order matters within an area. When multiple dimensions are stacked or nested, it's recommended to put the most granular dimension at the bottom.
- You can have a dimension in multiple areas. If a dimension is present in a row or column and also a page selector, when an item is selected in the page selector, it automatically adjusts to only show that item in the row or column.
Adding Group Dimensions
When a dimension has a group property, you can add it to the view by clicking the + symbol. You can identify a group property by the original dimensions name followed by a > and the group property. You can add a group property as a page selector to make dynamic selections. When you select an item from the group, the view automatically updates to show items within that group.
Scenario Pivot options
Scenario Pivot is automatically added to your Pivot panel in the last position in Columns. When looking at a grid, it might not appear obvious because the header might not be shown if only one Scenario is selected. By selecting Always Show header, the name of your scenario will appear even if only one is selected. You cannot move Scenario to Pages because the Scenario Selector is always present.
Pivot on Tables
When using Pivot on a Table, there will be a new section added to the bottom labeled Metrics. There will also be a N Metrics with N representing the number of Metrics in the Table. Use the N Metrics to control if the Metrics are located in the Rows, Columns or Pages. The Metrics section below will control the order of the Metrics in the Rows or Columns. To adjust drag and drop them in the desired order. If there are “Show value as” Metrics in the Table, you can adjust their order in the Metric section.
If you want to change the order of Items in Pages, Rows, or Columns, use the Sort functionality. To adjust the order or Calculated items, right click on the Calculated item and select Edit Calculated Item, there you can adjust the Position.
Pivot on Lists
The pivot functionality is not present on lists. However, there is a similar functionality labeled Properties in Dimension and Transactions lists. You can use the + icon next to Pages or Groups, to add group properties to your view. You can set a list as its own page selector to allow members to focus on one item at a time. You can hide properties from a view by clicking the ellipsis(...) next to the property and selecting Hide. You can then save this view and publish it on a Board. When a list is displayed, the properties appear in the columns, to reorder the properties within a list, simply drag and drop them into the desired order.