


It is good practice to occasionally review your model and find ways to optimize it. Optimizing your model can lead to improved performance, speed and ease of maintenance. There are many different ways to optimize your model, this article focuses on using insights from Block Explorer to identify your slowest performing and most dense Metrics. We also provide some tips on how to improve them.
This article references insights available from the Block Explorer and on the Metric. You need to have full Read access rights for the data on the Metric to view Size and Density insights. For all other performance insights, Members need the Configure Blocks application permission to toggle on those columns and view statistics.
Identify the slowest Metrics in the Application
The first step in optimizing your model is to identify the slowest Metrics in your Application.
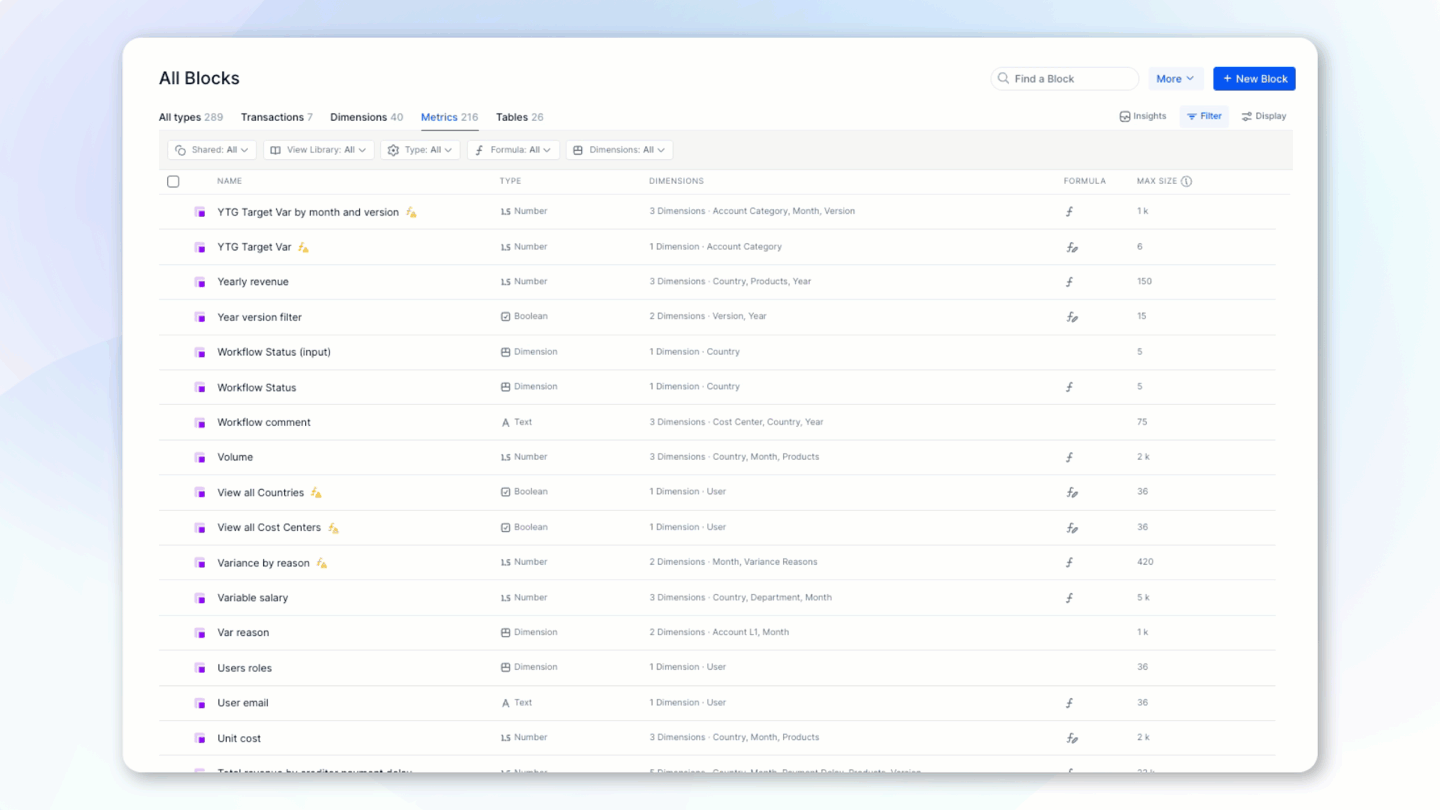
- Open Block Explorer, navigate to the Metrics tab and click Insights.
- Toggle on the following settings to view statistics and help you identify what’s slowing down your Application:
- Number of formula executions. This column identifies the Metrics in which formulas have been executed the most times in your Application over the past 15 days. Hover over this value to view the number of executions over the past 24 hours or any trends in this statistic. Formula optimizations or modeling improvements on these Metrics will have the highest impact in the performance of your Application, as the number of executions indicates the number of computations that are occurring on the Metric.
- Average execution time. Use this column to sort and identify the slow Blocks in your model based on the average execution time over the past 15 days. Hover over this value to view the same statistic over the past 24 hours, as well as spotting any unhealthy trends in your Application. For example, an upward arrow indicates that the formula execution time has increased. At this point, you need to review any recent updates in the Metric’s formula that has resulted in reduced performance and slower execution time.
- Last execution time. Use this column to view the latest Metric formula execution time from the past 24 hours. This can help with see the impact of any short term optimizations you might have made on the Metric.
- Maximum execution time. Use this column to identify the slowest Blocks in your model. It gives an insight into the highest risk formulas that were the slowest to execute over the past 15 days. Hover over this value to get the same insights but with a trend over the past 15 days or past 24 hours.
- Total execution time. Use this column to display the sum total of formula execution time for all formulas executed on the Block over the past 15 days. Hover over this value to get the same insights but with a trend over the past 15 days or past 24 hours.
The Total execution time column can be used to identify Metrics that are taking the most ‘computation power’ in your Application. This gives a good indication of those Metrics to focus on to improve the performance of theApplication.
The Max Time column is a great way to identify Metrics with the highest risk of having formula timeout errors. These timeout errors result in your Application’s calculations not working. Focus on Metrics with a maximum formula execution time closest to a 3 minute limit to reduce this risk.
For optimal insights on your Metric’s formulas, use the values in Max time and Average time together. The maximum formula execution time indicates the slowest possible Metric in the Application over the time period, while observing the average formula execution time gives a sense of the typical execution time for the Metric’s formula on average over the time period.
Use Performance Insights on a specific Metric
When you’ve identified the slowest Metrics in your Application, you may need the same insights on specific Metrics. Select the specific Metric you want to analyze, and then toggle on the Performance Insights panel from the top right to view the same statistics that are described above. This is a convenient way to see the impact of any changes you’re making on your model.

Use Performance Insights in Formula Playground before creating your Metric
When building new metrics, it is highly recommended to use the Formula Playground to analyze and optimize your formulas before creating the metric. Access the Performance Insights panel within Formula Playground to test the performance of your formulas before creating the metric.

Best practices for improved formula executions
Some recommendations for making Metric formula executions faster:
- If the Metric contains a long formula with nested functions, consider breaking up the formula up into Metrics and then referencing those Metrics in the formula. This results in a shorter formula per Metric, which may reduce execution time.
- When you break up your formulas into multiple Metrics, ensure that you use formula calculations in a Metric once. You can then re-use that Metric by referencing it multiple times if needed. This reduces the number of formula executions and optimizes performance. It also reduces the number of Metrics needed and reduces maintenance.
- Ensure that your formula is performing calculations on a smaller scope of your data. Narrowing this scope as early as possible prevents you from performing unnecessary calculations on data that will be discarded later.
- For example, if you use a formula on a Metric using the FILTER function on specific Items of the Dimension. This formula is more performant than if you don’t use the FILTER function. Try to build your formulas to calculate on the smallest possible scope of data for that calculation.
- The order in which you list functions in a formula can greatly improve performance.
- For example, reduce the data size as soon as possible within your formula using IF() or [FILTER:] or [SELECT:] before doing additional aggregations using functions or [REMOVE:] or [BY:]. Next, do allocation by adding new dimensions using [ADD:] or [BY:].
Leverage the “sparse Pigment engine” where possible
Metrics perform better in Pigment on sparse versus dense data. While there are instances where you will need to have values in every cell, there are instances where you can use Blanks vs 0 or False. Therefore, the goal is to ensure your blocks are as sparse as possible. For more information, see How Pigment Handles Sparsity in Formulas.
Identify the most dense Metrics
Sort your Metrics using the Size column in Block Explorer to determine the densest Metrics in your Application. We recommend starting your review of densest Metrics with these blocks to see which ones are the most inefficient. The Max Size column gives you an indication of the theoretical densest possible Metrics in your application. The Density % column gives you an indication if these Metrics are at risk of becoming your densest Metrics.
In the Dimensions column, review the Dimensions on your Metrics and the number of items on those Dimensions. There is also a Number of Items field in Block Explorer for this purpose. Assess if you can reduce the number of Dimensions in your Metrics, or reduce the size of those Dimensions.
Quick tips for making Metrics more sparse
- Review functions like
IFBLANK,ISBLANK,ISNOTBLANKand see if they are needed, or if the output of the formula is being populated with values that can be replaced with BLANK instead. - Review any usage of zeroes (
0) instead of blanks and see if it is needed. - Review any usage of false (
FALSE) instead of blanks and see if it is needed. In particular for Access Rights, if you are on the current version of Access Rights, useBLANKinstead ofFALSE. This behaves the same and produces a more sparse Metric.
The number of items in your Transaction and Dimension Lists is another factor, it is also a good idea to check the size of these to make sure they are accurate.
Align the structure of your blocks with formulas
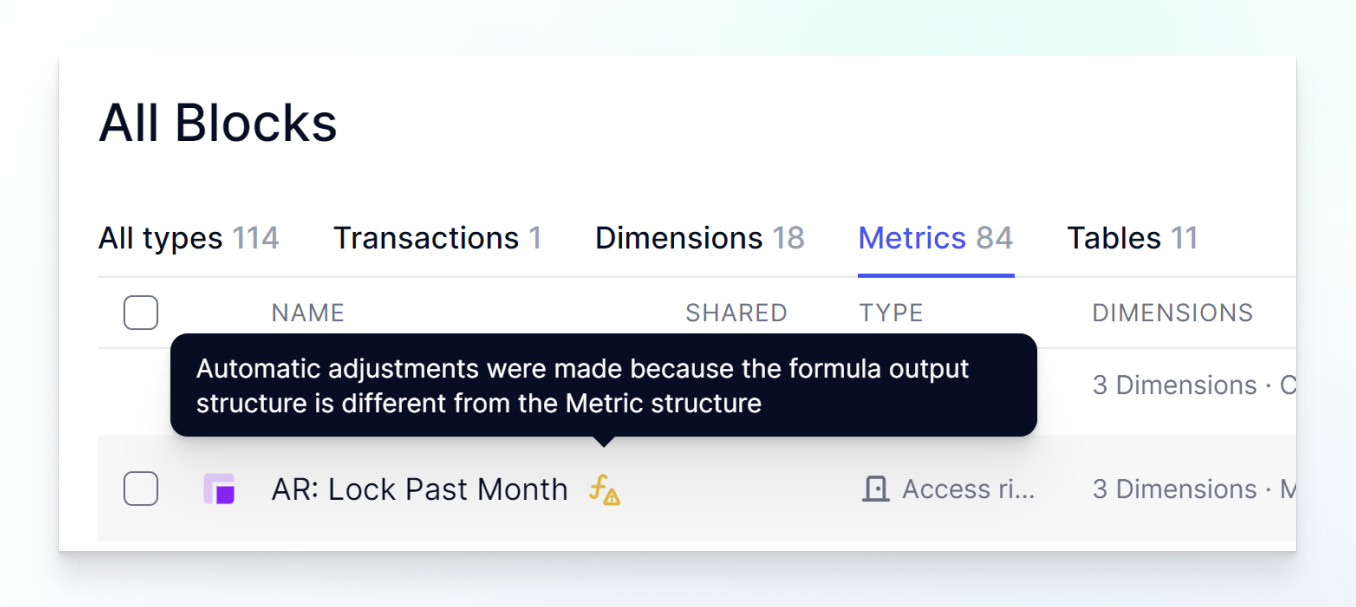
Your formula’s output should contain the same dimensionality as your Metric’s structure. Misaligned formulas can result in unexpected results and aren’t performant. Review any blocks containing formulas that are misaligned with the structure of the Block. Optimize your formulas by explicitly adding or removing those Dimensions in the formula itself. For more information, see Dimension Alignment Indicator.
Keep your model clean by removing unused blocks
Unused Blocks can result in inefficient models, especially if they are dense. Toggle on the Used Block indicator to check on the usage of Blocks and delete them if unused. You can check the detail of where the Block is being used in the Settings of the Block, under the Block Usage section.
Review blocks that are central to your model to ensure the formulas are optimized
Use the Referenced field to determine which Blocks are most central to your model. This number reflects the number of Blocks referenced in the formula of the Block, so it means that the Block with the highest number is being used by the most Blocks in your application.
Any modifications or improvements on these central Blocks will have a lot of downstream impact - it can be a good idea to start your review on these Blocks!
Quick tips on formula optimizations on these central Blocks:
- Reduce the length of formulas where possible.
- Avoid nested IF statements that are hard to read or maintain and are not performant.
- If you can perform the calculation on multiple intermediary Blocks rather than a single Block. It’s more performant to split this up.
Export Block Insights from the Block Explorer for further analysis
If you need to analyze the insights from Block Explorer for further analysis and advanced filtering, sorting and further analysis, you can export the insights displayed in your Pigment block explorer panel as a CSV file. Click on the More button at the top right of Block Explorer and Export Block Insights for All Transaction Lists, All Dimension Lists, or All Metrics in your application. The CSV report also contains more information on the columns added or removed due to misaligned formulas.