When working in Tables and Metrics, you can filter your views to make them better for Boards or Charts. This article will discuss how to use Filters in Pigment.
Table of Contents
How to Access and identify Filters
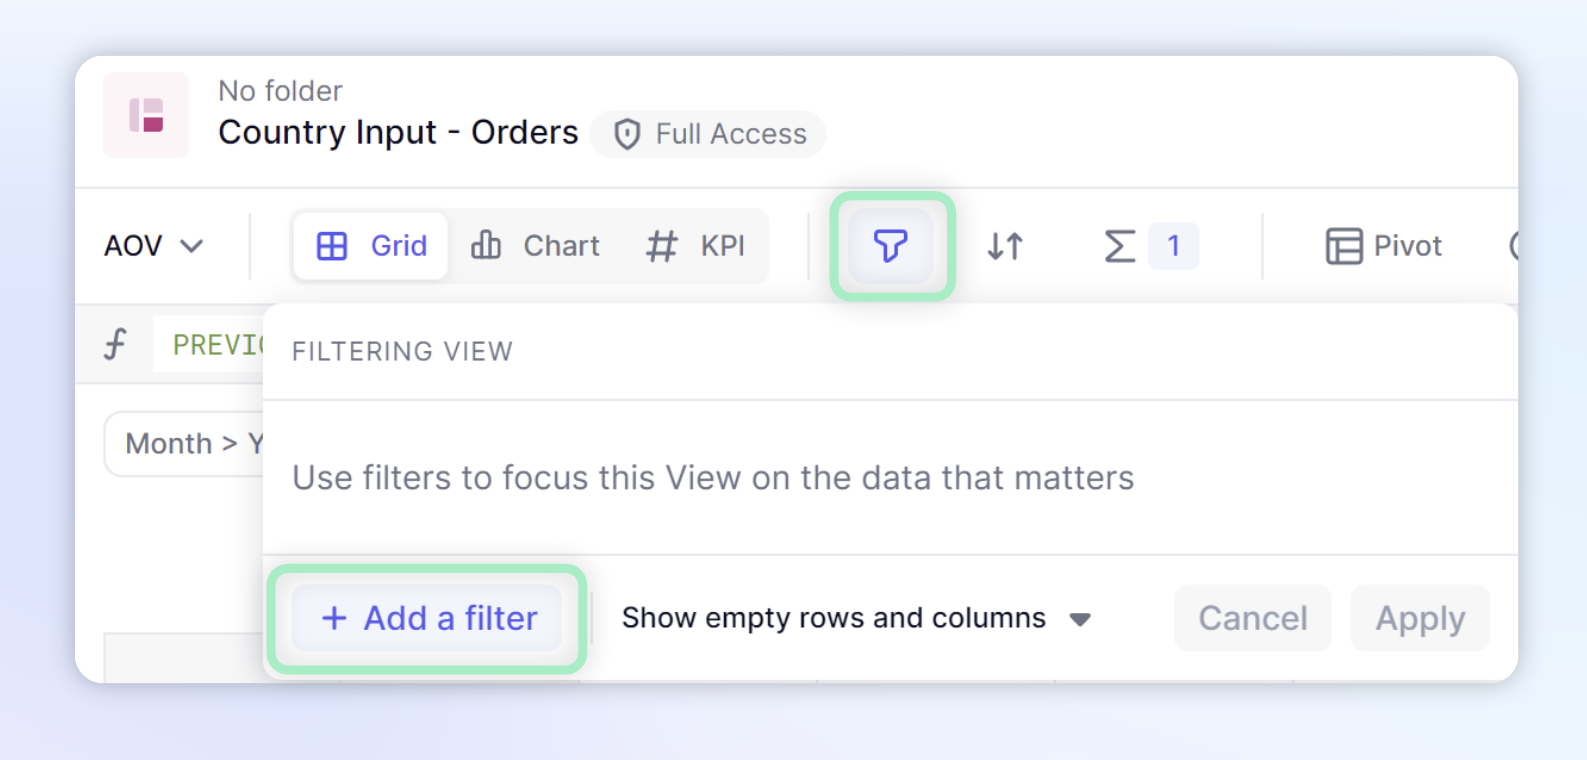
From within either a Metric or table, you can activate a filter by clicking on the Filter icon and selecting +Add a Filter. Once a filter is applied, you will see the number of filters next to this same icon.
Select the dimension you want to filter
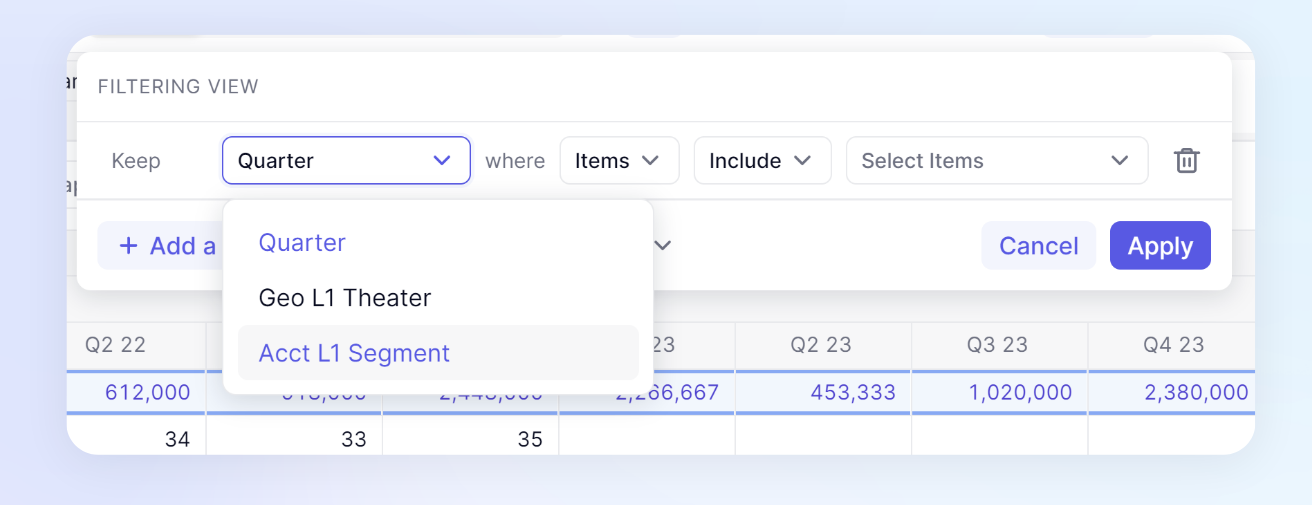
After you select + Add a filter, you have to use the drop-down to decide which dimension you want to filter. Only dimensions in Rows or Columns can be filtered. After you choose the dimension you want to filter, you can filter by directly entering the items or by basing it off of the metric’s value.
Filtering by Items
Filtering by Items will allow you to select items from within that dimension list you want to either Include or Exclude items from that dimension. You can apply these filters to all dimensions that are present in Columns or Rows.
If you select Include it will only show those items. For example, if a filter is set to Filter Product where Items include Product A the result will be that only Product A is shown.
If you select Exclude it will only remove those items. For example, if a filter is set to Filter Product where Items exclude Product A the result will be that only Product A is the only item not present. When choosing these options it's important to think of the future of the list. When using the exclude option, all new items will be down.
Filtering by Metric Value
Metric value allows you to filter items depending on the value that is present within the cells. When using Metric values, your options are dependent on how your Pivot configuration is set up. In order to be eligible for filtering by Metric Value, the dimension that you want to filter must be in the bottom position for either Columns or Rows.
You can easily filter data in tables by Metric value by right-clicking on the specific grid header you want to filter by. Each new filter you add using this method will create a separate rule in the filter panel. When you use this filtering shortcut in a tree view, filtering is applied to the closest Dimension to the grid. We recommend that you expand the tree view before filtering. When multiple Metrics are available for filtering on Tables, you need to choose just one Metric.
Filtering by Property
Filtering by Property allows you to filter a dimension based upon values stored within that dimension’s properties. Depending on the property data type, you will get different options on the type of rule you can set it.
Eligible dimensions for Filtering examples
| In the example to the right, you would be able to select the Metric value for the Month or the Scenario dimension. These are what we consider the most granular dimension within a view.
| 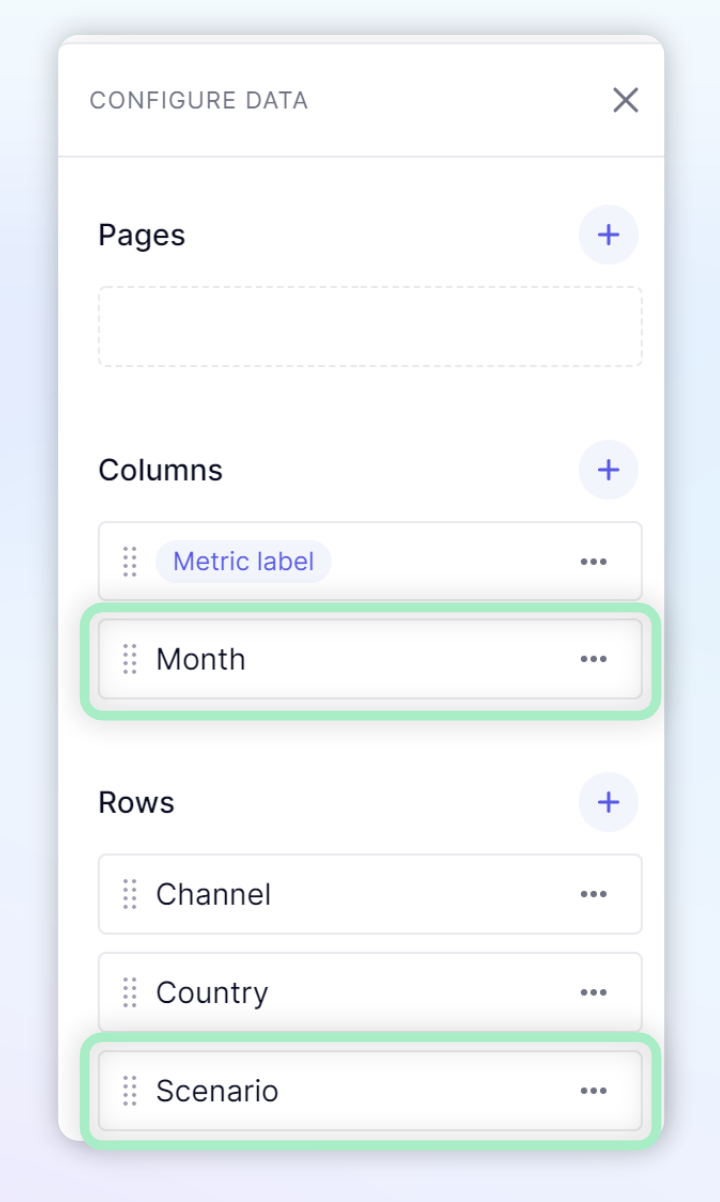
|
Operators in Filters
After you choose which dimension, you want to filter, you will have to choose an operator such as =, <,> and enter a value on which to base those operators. These are dependent on the item type, for example, operators such as Contains exist for text data types metrics.
Adding Multiple Rules to a Filter
When adding multiple rules to a filter, you must set how the rules interact with each other, the options are OR and AND.
The AND operator means that all conditions must be met for the rule to be true. For example, if you have two rules: Rule A: The sky is blue and Rule B: It is daytime, an AND combination would only be true if both Rule A and Rule B are true - that is, if the sky is blue and it is daytime.
On the other hand, the OR operator means that only one of the conditions needs to be met for the rule to be true. Using the same rules as before, an OR combination would be true if either Rule A is true (the sky is blue) or Rule B is true (it is daytime), or if both are true.
In summary, AND requires all conditions to be satisfied, while OR requires at least one condition to be satisfied. When setting up multiple rules, you can only use one of these options for the entire filter. This means all rules will be set to the condition of OR or AND.
Combining Filtering and Sorting to see Top and Bottom brackets
When filtering with Metric values of Integer, number or dates, you can choose to filter items in either the top or bottom brackets by defining how big of a bracket you would like and if it should be the top values or bottom values. After selecting Metric value, use the operators dropdown to choose either is in the top or is in the bottom , next enter a number to define the size of the bracket. For example, if you wanted to see your top 5. You would select is in the top and then enter 5. Once the filter is activated, it will also activate the Sort functionality. The Sort’s location is determined by if you choose the Top or Bottom. This filtering option will ignore blank values.
Identifying Item specifics from opposite Dimensions
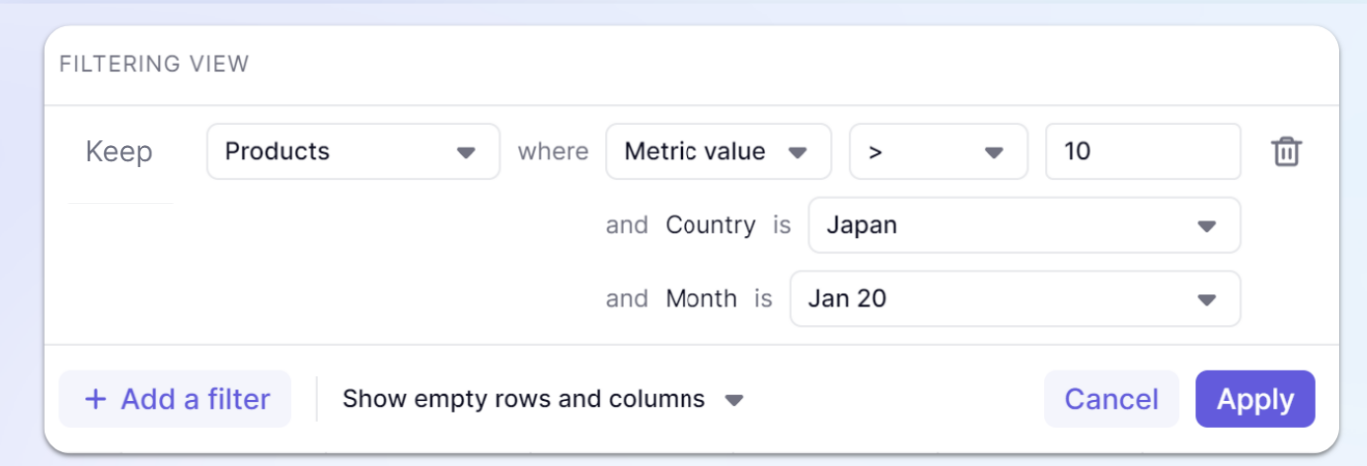
When using a Metric value, you must identify the specific items from the dimensions opposite of the filtered dimension. This means if your filtered dimension is in Rows, you have to show the specifics for the dimensions in the Columns and vice versa. The position of these is determined by the Pivot panel.
In this example, the Products dimension is in Rows, the Country and Month dimensions are in Columns. If you want to filter off multiple items from the opposite dimensions, you can create multiple Filters.
Hiding empty rows or columns
When working with Metrics or Tables, you can hide empty columns or rows if they have no data. From within the filter, you’ll see Show empty rows and columns. Click on this dropdown and you can see there are multiple options. You can hide empty rows or columns either separately or together to make your data easier to find.