


When working with orders, revenue, stock or even costs, it can get interesting to know either when the values started or when they stopped. This can be useful to understand when a customer started ordering, or when a specific contract stopped.
This is a small modeling guide detailing a thought process to get to a working formula. Your business case may vary!
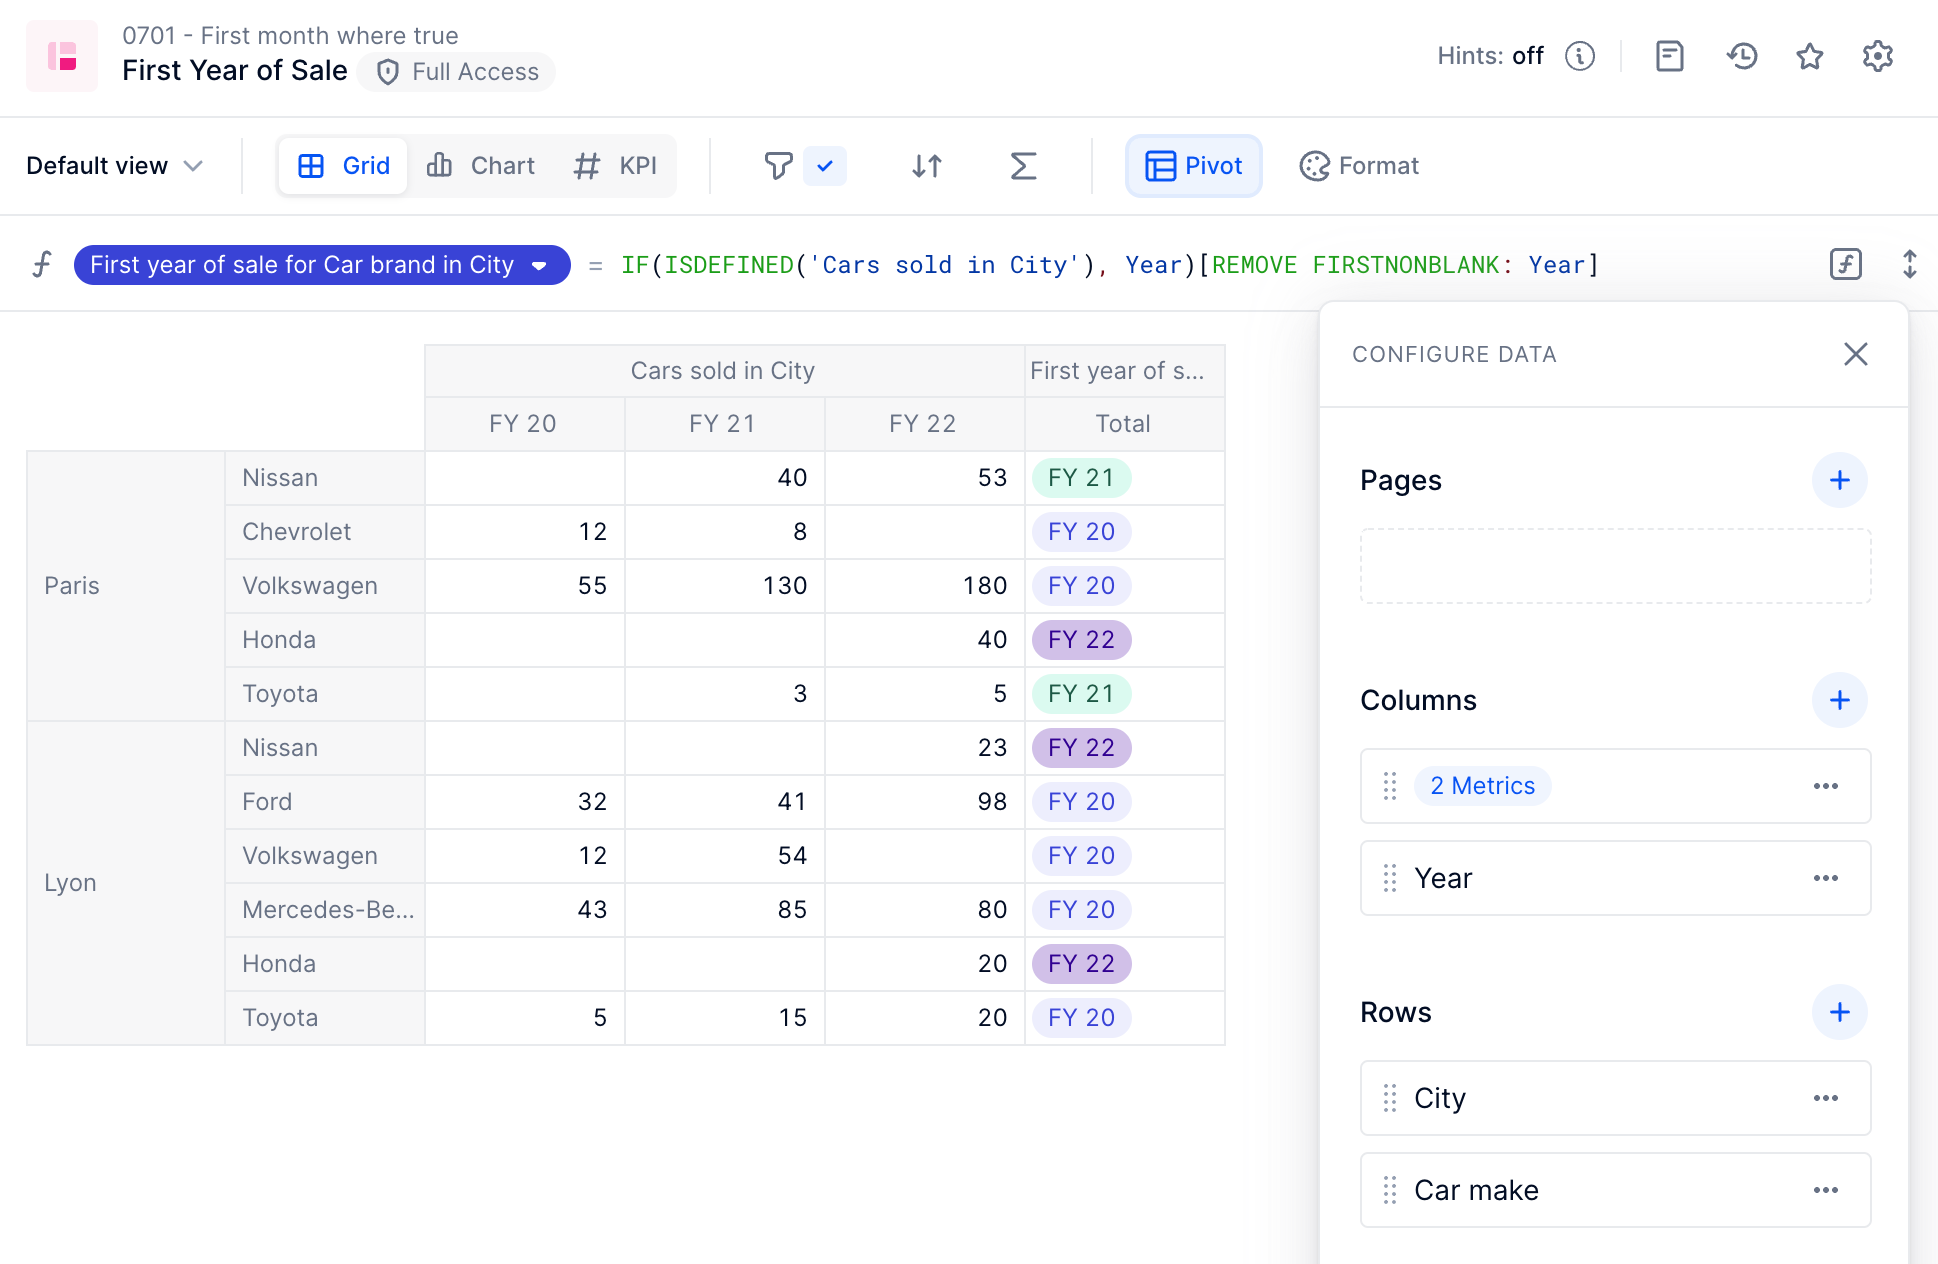
In this example, I’m working on car sales in different locations. We’ll try to find the first year on which a car brand was sold in a specific city.
Here’s my source metric:
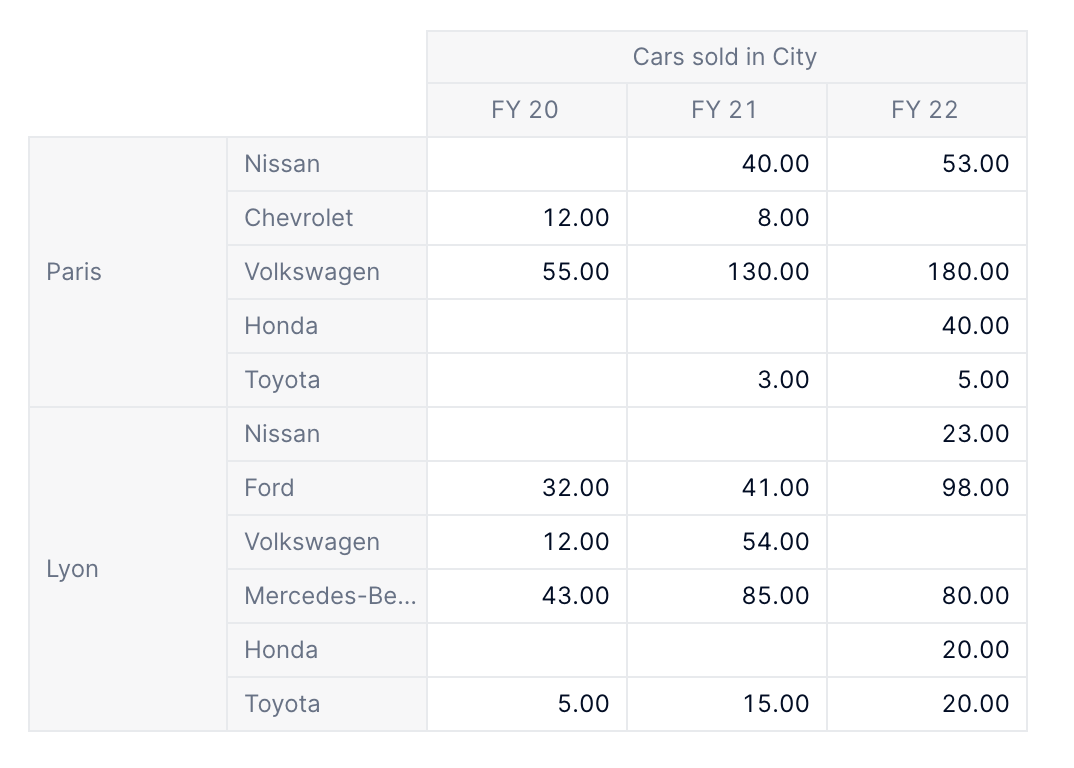
For example, you can see I’ve sold 40 Nissans in Paris in 2021, and 53 Nissans in 2022.
The final information I want to get is that for that specific intersection (Paris, Nissan), the first car that was sold was in FY21.
Thinking of a condition
The first step towards building this is building the condition. I’ve opened a formula playground, and here’s what I can come up with:
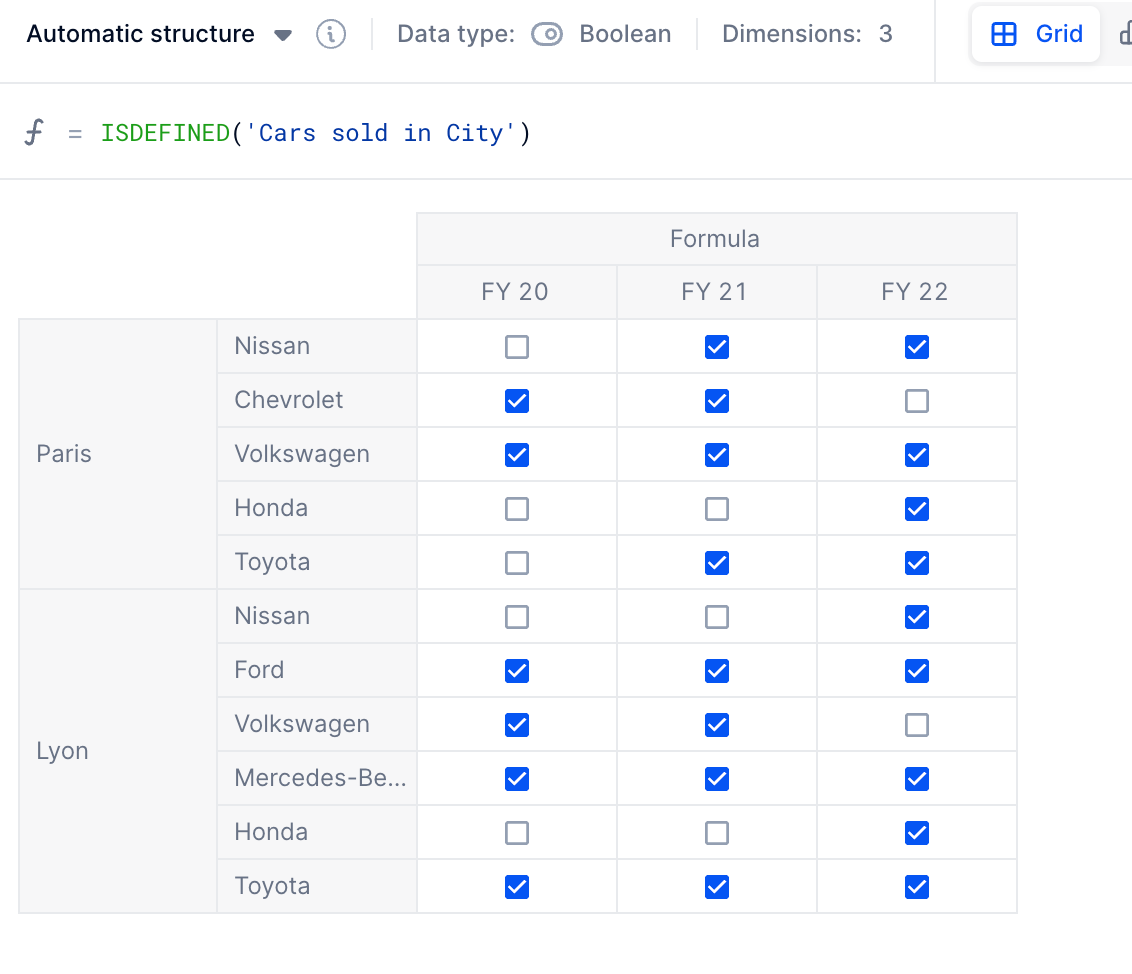
The formula I’ve chosen is based on ISDEFINED, which I find is always a good choice because it gives you the value TRUE whenever there’s something in the source metric. Obviously I could have a 0 in my car sales that could still represent a sale (+1/-1?) but you could also adapt your condition to what fits you: 'Cars sold in City' <> 0 works exactly the same with this specific dataset.
Turning that metric into a Year-formatted result
To turn the boolean into a Year-formatted result, I’m using an IF statement that replaces my condition with the Year that’s in that specific intersection:
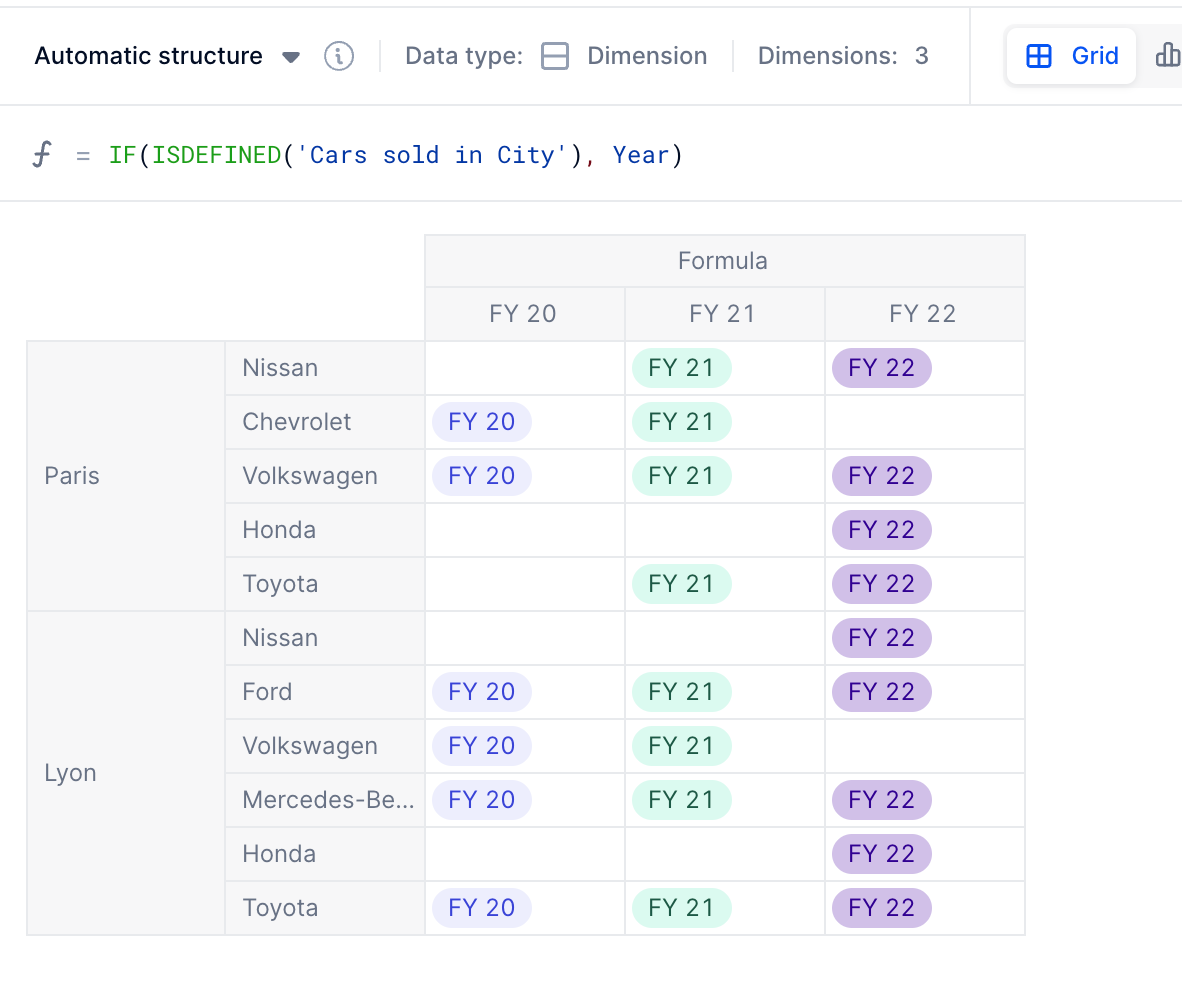
Notice that the automatic Data type from the formula playground has changed from Boolean to Dimension, but the structure has not (still 3 dimensions). The results displayed are not Years, and not simple True / False.
Getting the final result
My last step will be to get the first Year where we’ve seen a sale, and to do that I can use a REMOVE modifier that will get rid of the Year from the structure. I’m using the FIRSTNONBLANK modifier to get the first value that’s present for each Car / City intersection. Here’s the result:
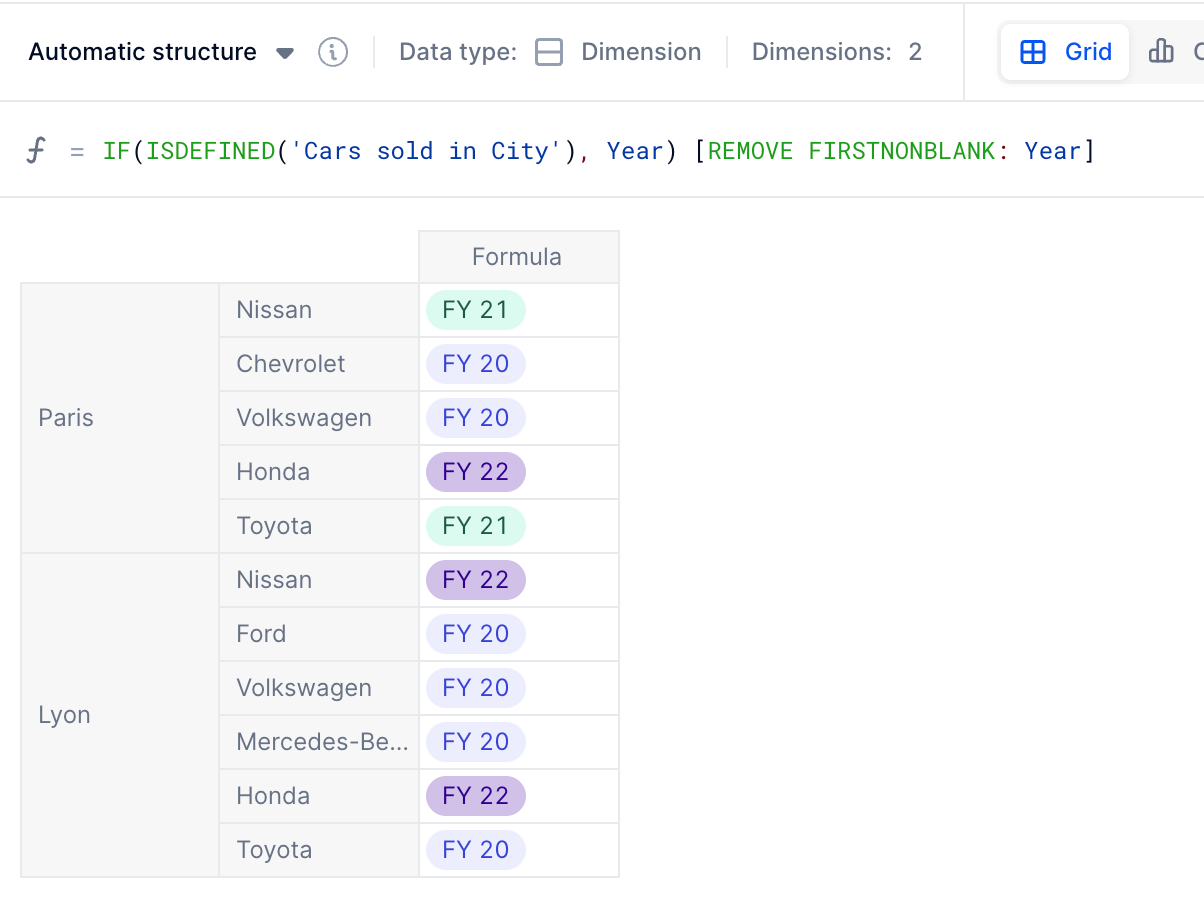
The data type has not changed, despite the REMOVE: it has changed the structure though, as we’ve come from 3 dimensions (Car, City, Year) to only two (Car, City).
You can now save your metric as a new one, and display it in a table next to your car sales!
Building formulas can be hard and takes time, but taking one step at a time ensures you know where you’re going and that you have coherent results on the way. If you think you can explain the transformation using a pen and paper, chances are you’ll be able to build the formula on Pigment! As always, done is better than perfect.