Best practices for Mapping in Pigment
In almost every Pigment model there is some kind of mapping used. Mapping is basically creating a link between 2 items (e.g. Country vs Region → France is in Europe). Mapping in Pigment can be used in different situations. A few example situations are:
-
To transform your data from a transaction list into a Metric
-
Move your data from one Metric to another Metric with different dimensionalities
-
Indicate a unique combination based on a specific context (e.g. Employee by Cost center by Month)
-
To build hierarchies
This article describes the most common use cases for mapping and the best practices to make your modeling as efficient and simple as possible. Currently, there are 5 mapping methods described in this article. Please reply in the thread below if you have any additional questions, feedback or suggestions!
| # | Subject | Use case example |
| 1 | Mapping 1-1 (mostly for hierarchies) | Roll up of a dimension. Country → Region or Product → Product Group |
| 2 | Mapping N-1 | Roll up from 2 (or more) dimensions into 1 (e.g. combination of Department/GL Account into P&L Account |
| 3 | Mapping in a Transaction List | Transforming data from a transaction list into Metrics to calculate, analyze and report |
| 4 | Time Dimensioned Mapping | Transforming data from a transaction list or Metric into another Metric with different dimensions where mapping can be different over time |
| 5 | Preventing unmapped items | If dimensions are updated regularly and fully automatic it can be helpful to notify any key-users that a mapping needs to be maintained |
Table of Contents
Mapping one to one (1-1)
The most common use case for a mapping is a 1-1 dimension mapping. Mostly used for hierarchies (e.g. Country → Region, Product → Product Group) but it can also be used for other 1-1 mappings. In this example we’ll use a Product → Product Group mapping. There are 2 ways to do this:
-
Create a mapping property inside a dimension list
-
Create a mapping Metric
Both options need to be set-up in the following way:
-
Dimension: Product
-
Format of mapping property or Metric: Product Dimension
When the mapping is filled you can use it in a formula like this:
-
Formula example: SourceMetric [BY: Product.Product Group]
-
Source Metric dimension: Product
-
Target Metric dimension: Product Group
There are a few reasons why a mapping in a Metric can be better than mapping directly in a dimension:
-
If you want to publish the mapping on a board (possible with a dimension but easier with a Metric)
-
If you want to apply a formula on the mapping and want to be able to override the formula
-
If you want to show the mapping inside a table alongside other Metrics
Mapping many to one (N-1)
There are cases where you want to merge 2 dimensions into 1, or create a combination grid to define logic on combinations of dimension items. In this example we’ll show you how to set that up. The example we’ll use is to map data to a P&L Account based on a combination of a Department and GL Account. We want to map to a different P&L account if data is stored on a specific department.
Mappings like these can’t be set-up within a dimension but always need to be set-up by using a Metric. The dimensions of the Metric will be equal to the source data. So in this case our mapping Metric has 2 dimensions: GL Account & Department. The format of the Metric will be the dimension P&L Account.
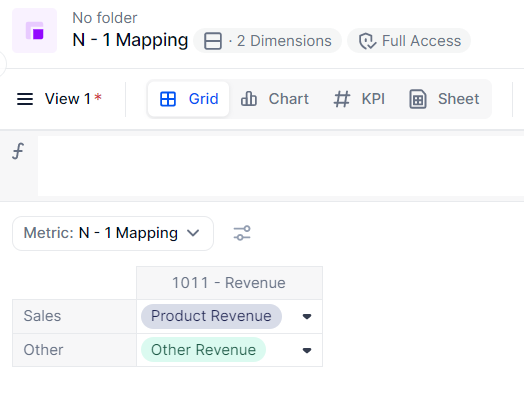
As you see in the screenshot above the 2 dimensions are pivoted in the view for readability (Department in rows, GL Account in columns). Based on the Department we want to map the revenue data to another Revenue P&L Account (Product or Other).
This mapping can be used in a Metric by a similar way as the 1-1 mapping in section 1.
-
Formula example: Source Metric [BY: ‘N - 1 Mapping’]
-
Source Metric dimensions: Department & GL Account
-
Target Metric dimensions: P&L Account
N-1 mapping in a transaction list
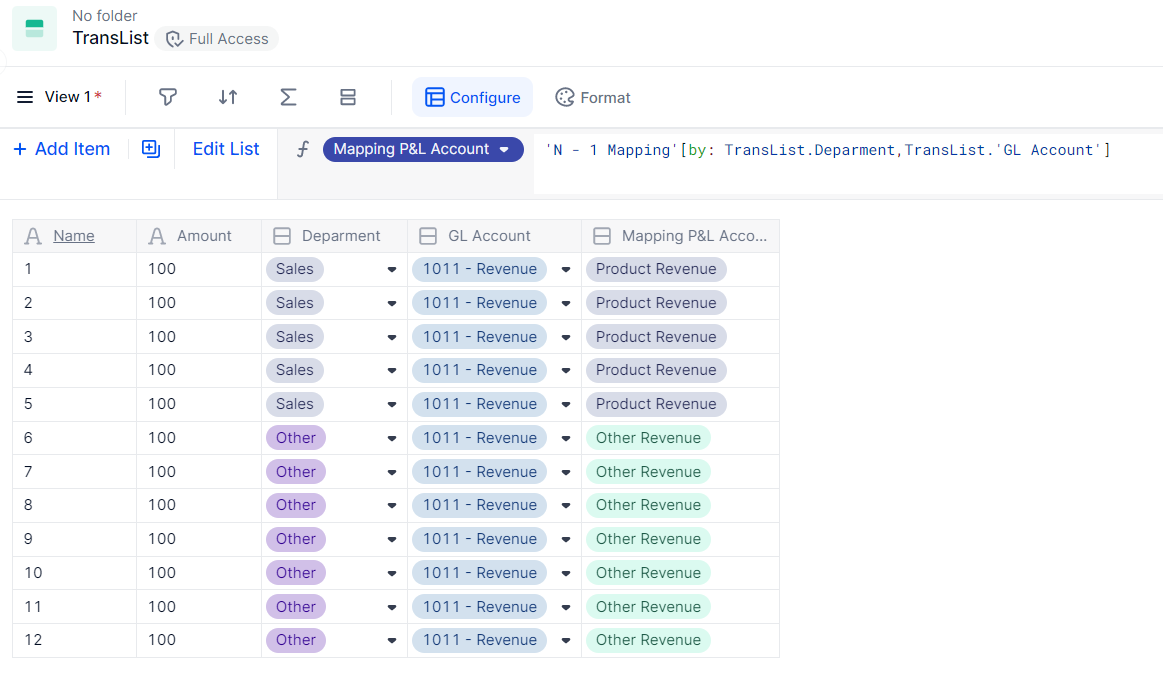
If you want to use a N-1 mapping with a transaction list as a source (instead of a Metric) create a property in your transaction list with the format P&L account. Connect your mapping to the transaction list property with this formula: 'N - 1 Mapping'[by: TransList.Deparment,TransList.'GL Account']
Now you can use this mapping as explained above in the start of section 2.
Mapping in a Transaction List (1-1)
Mapping in a transaction list is very common. For example your data comes in on a product level but you want to use it on a Product Group level where you map every product in a different grouping to use in your calculations and reports. However, for visibility and drill-down functionality you want to show the product grouping in the transaction list. There are 2 ways to do this, the correct method can be chosen based on your mapping requirements:
-
1-1 mapping: create a visible property and follow the steps below
-
N-1 mapping: create a normal property directly in your transaction list. Reference it with a formula to the N-1 mapping you’ve created (How to in section 2.a of this article)
The method to create a visible property is described below:
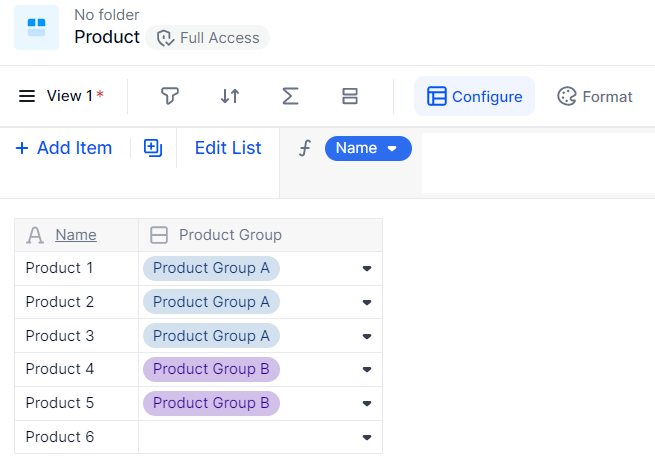
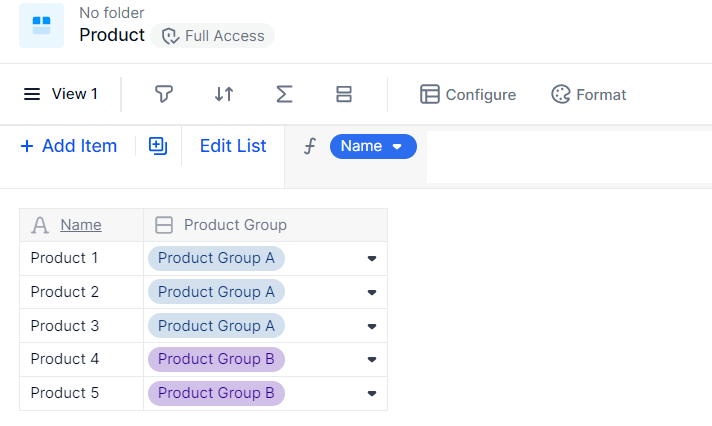
-
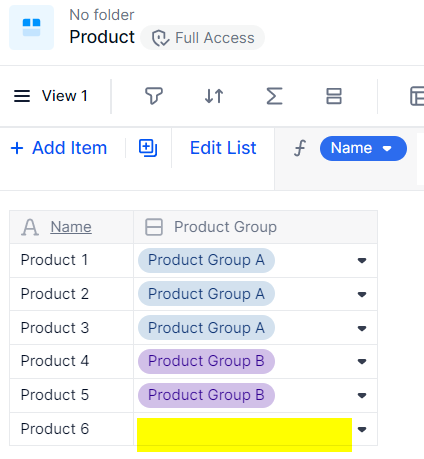
Create a property in your Product list with dimension type Product Grouping. In this example we’ve mapped Product 1,2 and 3 in Group A and Product 4 and 5 in Group B.
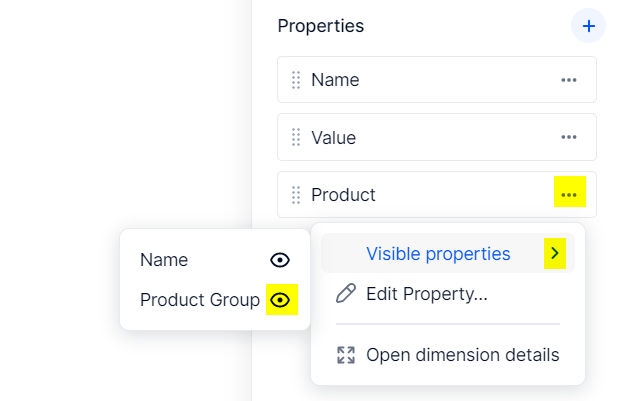
-
Go back to your transaction list and select the “Configure” functionality. Select the Product dimension in the sidebar and activate “Product Grouping” for the visible properties.
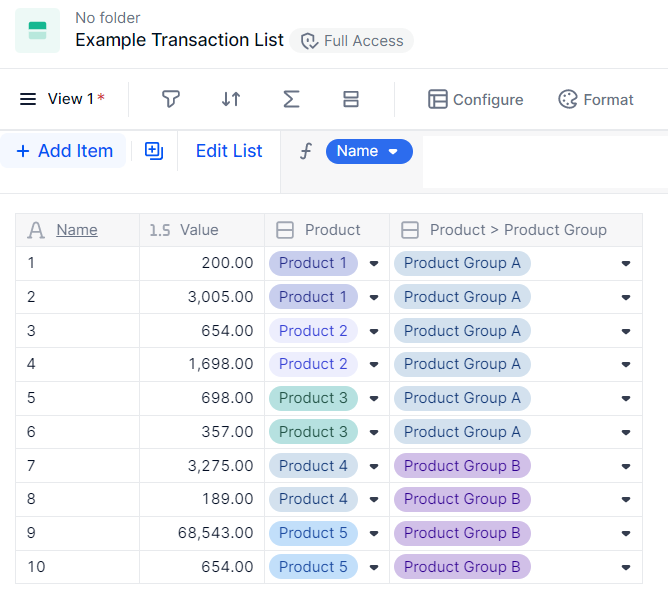
-
This will now visibly show the product grouping on every transaction item. You can achieve the same result by adding a “Normal” property in your transaction list but the method described above will be more efficient (especially for very large transactions lists) because the data doesnt “exist” on every transaction but is just shown in the front-end based on your original Product property.
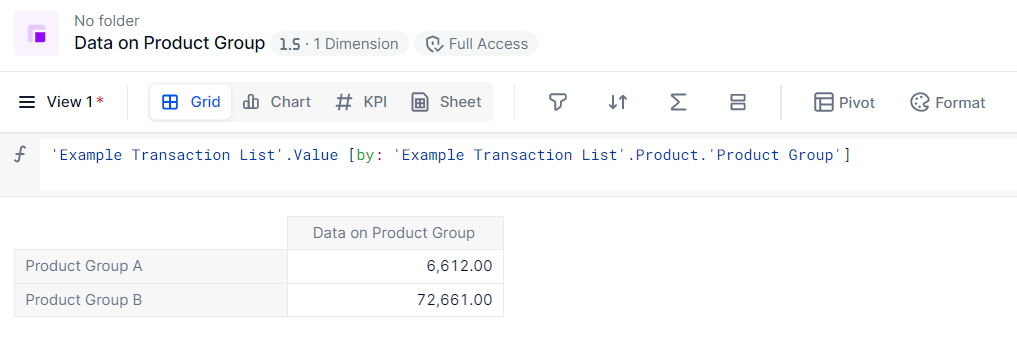
-
In your formula you can still refer this mapping in your Metric with the BY modifier as in the example below. With this method you can completely “skip” the Product detail and directly show your aggregated data on the Product Grouping dimension.
Time Dimensioned Mapping
This article briefly explains how to use a time dimensioned mapping. A new article with more details will be published soon.
Sometimes your mapping needs to be flexible over time. For example, the way you map your Product into a Product Group can change in the future but you want to keep your historical data as it was. Pigment offers a solution for this by using a time dimensioned mapping in a Metric. Below a description of how to set this up.
Note: if you want to use a time dimensioned mapping with a N-1 mapping, please read section 2 first. Then you can continue reading this section below and apply 2 source dimensions instead of 1.
-
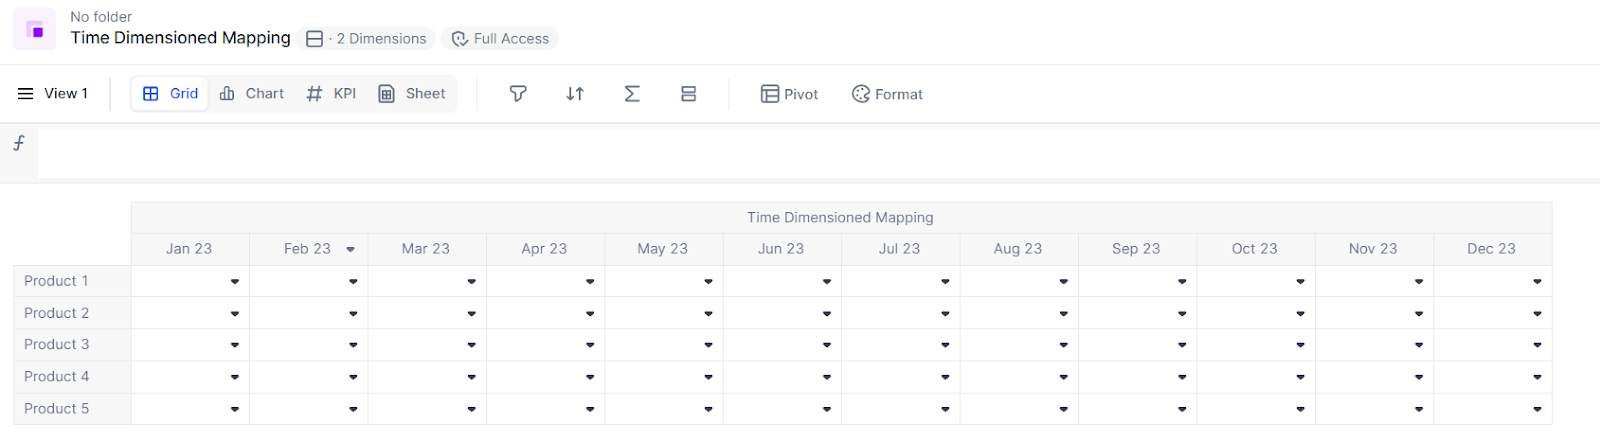
Create a Metric with a time dimension (Month) and the dimension you want to map (Product). Data type = Product Group.
-
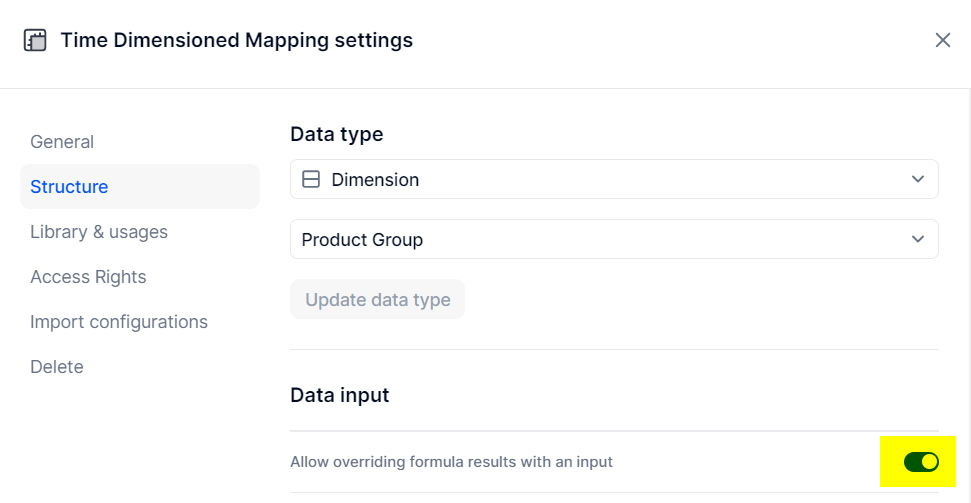
Turn on the override functionality for this Metric
-
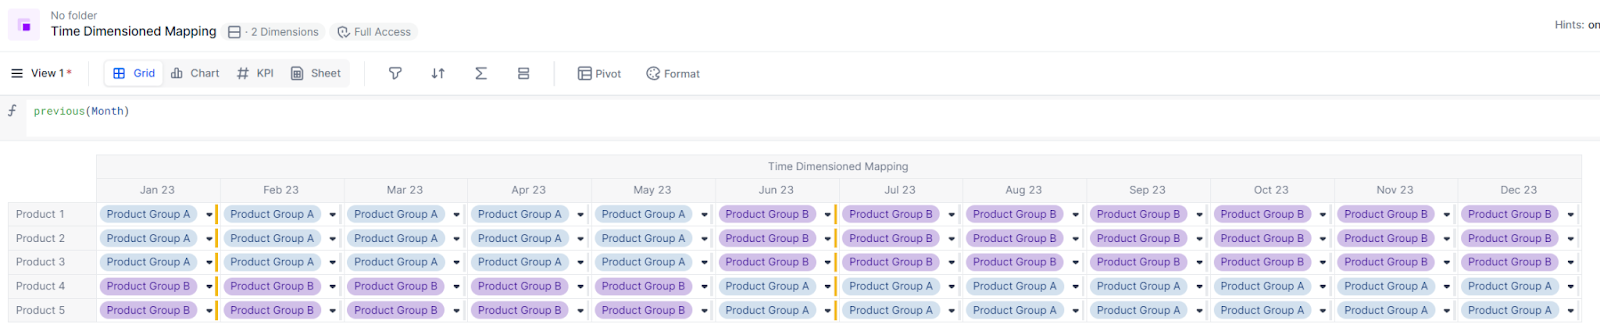
Apply the following formula: Previous(Month). Then fill in the mapping for the first month. This formula helps you with filling in the mapping as you only need to input it for the first month and the months that will change. Any empty month will be automatically filled by the formula based on the previous value. In this example the mapping changed from June 2023 onwards as you will see in the screenshot below. The months marked with a small yellow indicator are the ones where manual input is done (only January & June).
-
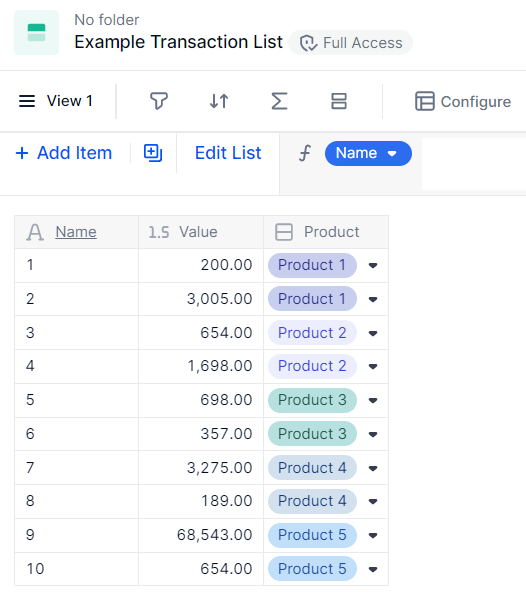
Now you can use this mapping in your formula with a BY modifier. Make sure that the month dimension is available in your target Metric. E.g. when your target Metric has the dimensions Product Group and Month you can use the below formula (make sure your transaction list also has a property Month.
'Example Transaction List'.Value[by: 'Example Transaction List'.Month, 'Example Transaction List'.Product; by: -> 'Time Dimensioned Mapping'; remove: Product]
Preventing Unmapped Items
When you use a mapping to convert your data to a different dimension one of the main vulnerabilities is that you have to maintain it. To prevent any unmapped items you can use the methodology described below to instantly see that something is not mapped correctly. In this example we have a new product that is added in our Product dimension which is not mapped yet. In Pigment, if a mapping is blank, it won’t be taken into account into your BY mapping.
-
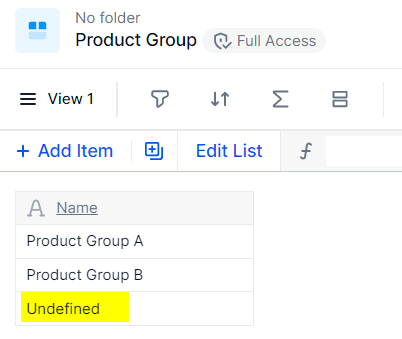
Create a new dimension item in your “Product Group” dimension with the name “Undefined” (or something similar).
-
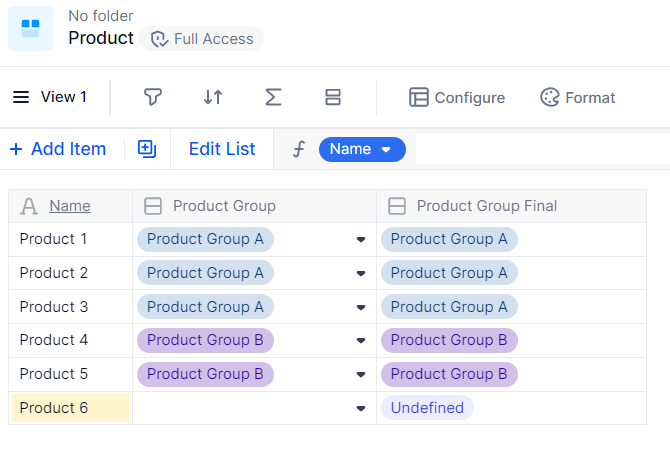
In your original mapping in the Product dimension add another property and name it “Product Group Final”. Then apply this formula: IFBlank(Product.'Product Group','Product Group'."Undefined"). Keep the original property to enable input as you can’t override formula values in properties.
-
Now use this mapping in your formulas. When a transaction is mapped to Product 6 it will automatically map to “Undefined” in the Product Group dimension and you will never miss the value in your totals. You can even make this more clear to your users by applying conditional formatting on the “Undefined” dimension item in your report.
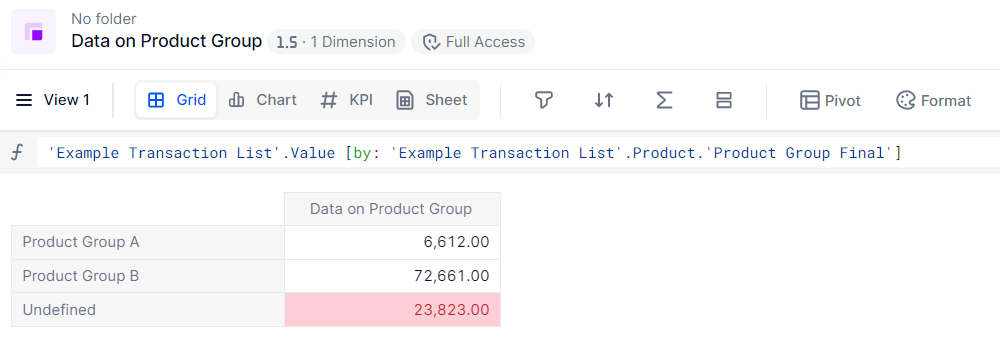
The best practice here is to add a board in your application and fill it with views that are filtered and formatted on any mapping errors (e.g. blank mapping or “Undefined”). With this board you make it easy for the end-user to do a regular maintenance check on the application. E.g. you can use the Countblankof function to count any unmapped items and publish that on a board by using a KPI.