


The purpose of this article is to provide guidance on how to phase revenue and/or costs over time, and also more broadly how to approach mapping data in Pigment calculations. In this example, I am envisioning a situation where I am trying to model the cash impact of revenue using generic payment-delay assumptions, but please be aware you can apply the same logic to phase costs based on invoicing terms, for instance.
Please note: this guide is made for beginner/intermediate modelers. If you need further information on the formulas or concepts mentioned here, please do not hesitate to access our help center. And of course, feel free to adapt your own application to your needs and business processes.
Please note: we are using this method because we are modelling an uneven phasing of revenue. If you wish to model an even phasing of revenue (e.g. for a given month of revenue, exactly ¼ of it will be allocated to the subsequent 4 months), then you can do that with the SPREAD() function.
Spreading Revenue - What We Are Working Towards
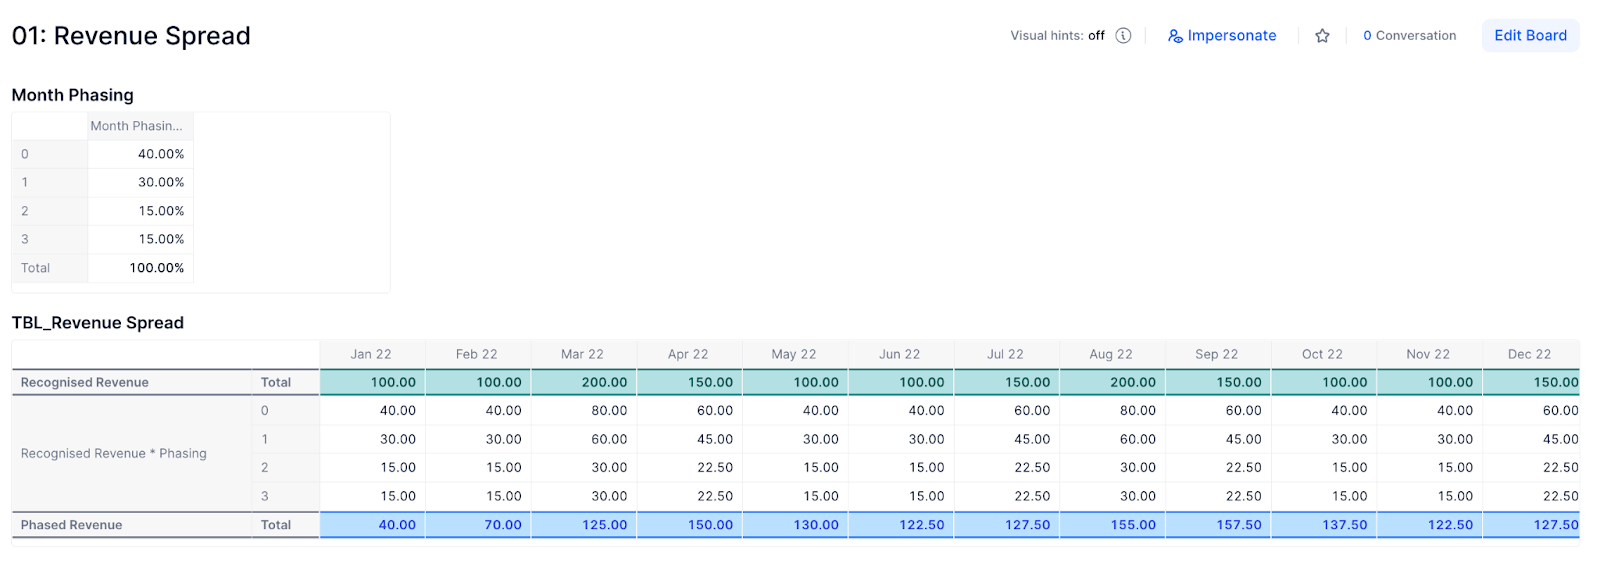
The screenshot below is of a board that these steps will help you reproduce. It contains:
-
A grid called ‘Month Phasing’, which is a metric in which the phasing percentages are entered in.
-
A grid called ‘TBL_Revenue Spread’, which is a table consisting of three metrics - one Recognised Revenue input, one phasing calculation, and one phased output.
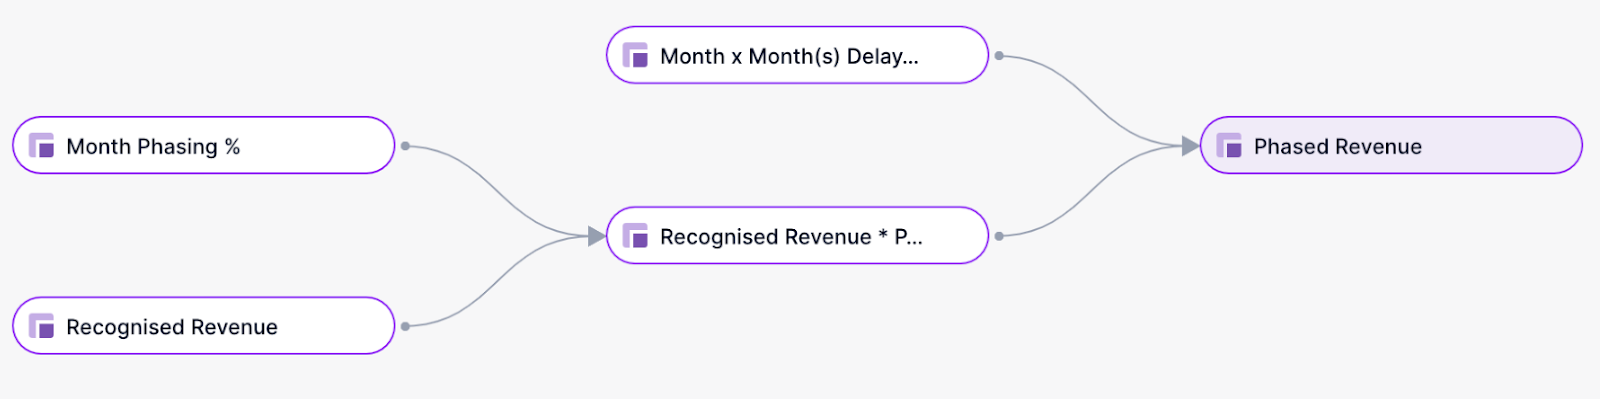
Below is a screenshot of the dependency diagram that we will be aiming to replicate as well. Only 5 metrics, so not too difficult!
STEP 1
One of the metrics we need to create first is our ‘Month Phasing %’ metric, as we saw on the screenshot of the board above. We need a new dimension list for this metric, so let’s create this first.
Step 1a: I have named this Dimension List ‘Month(s) Delay’. Your dimension list only needs one property, but it must have a Property Type of ‘Integer’ (this may not make sense now but I promise it will by the end of this article!).
There are four items in my list, but based on your use-case you can have as many as you wish.
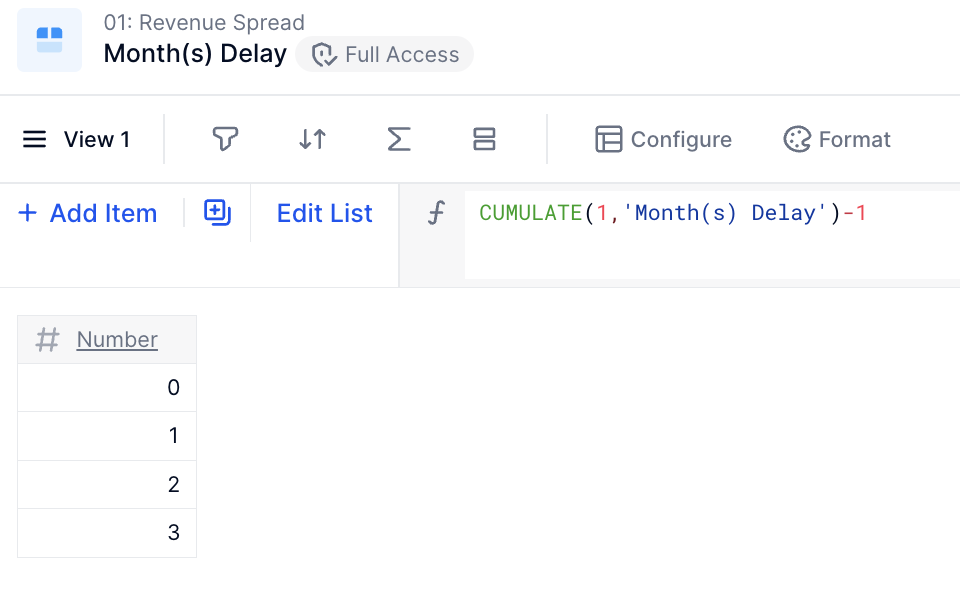
(SIDE NOTE: I am populating the values in my property automatically using the formula:
CUMULATE(1, ‘Month(s) Delay’)-1
This means when I add items to the list they are immediately assigned a number. This is not essential for this example but it is a useful trick that can make your life easier when handling lists.)
Step 1b:
Now that we have our dimension list, time to create our ‘Month Phasing %’ metric. This is a metric where ‘Month(s) Delay’ is the only dimension and Number is the Data Type. It has also been formatted as a percentage.
STEP 2
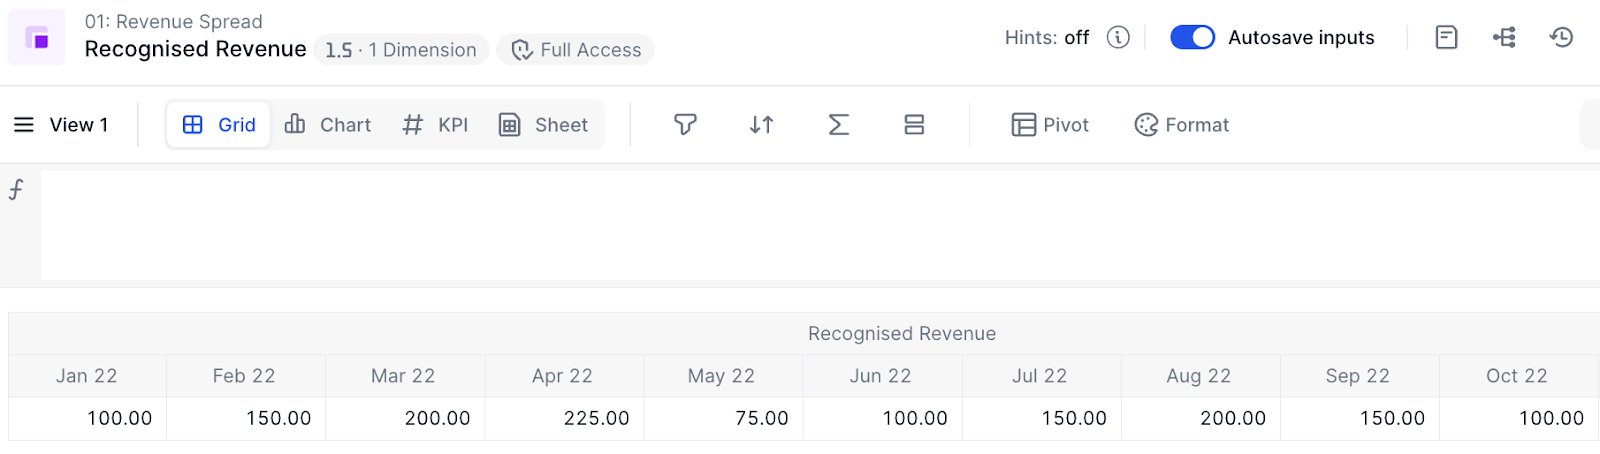
Next up - the ‘Recognised Revenue’ metric. This is the first row in the second grid on the board. In my example, this is dimensioned only by Month and is a manual input / data metric.
(SIDE NOTE: It is entirely possible that for your use case, some (or all) of these metrics will require more dimensions. For instance, your ‘Recognised Revenue’ metric may be dimensioned by ‘Location’, or your ‘Month Phasing %’ metric may be dimensioned by ‘Revenue Stream’. That should not pose a problem - you will need to dimension the relevant metrics by the relevant dimension lists, but the phasing logic should hold.)
STEP 3
Now, let’s use the two metrics we have made to create the ‘Recognised Revenue * Phasing’ metric.
This metric will be dimensioned by ‘Month’ and ‘Month(s) Delay’. The formula should be:
‘Recognised Revenue’ * ‘Month Phasing’
and the output (dependent on your inputs) should look something like the below screenshot
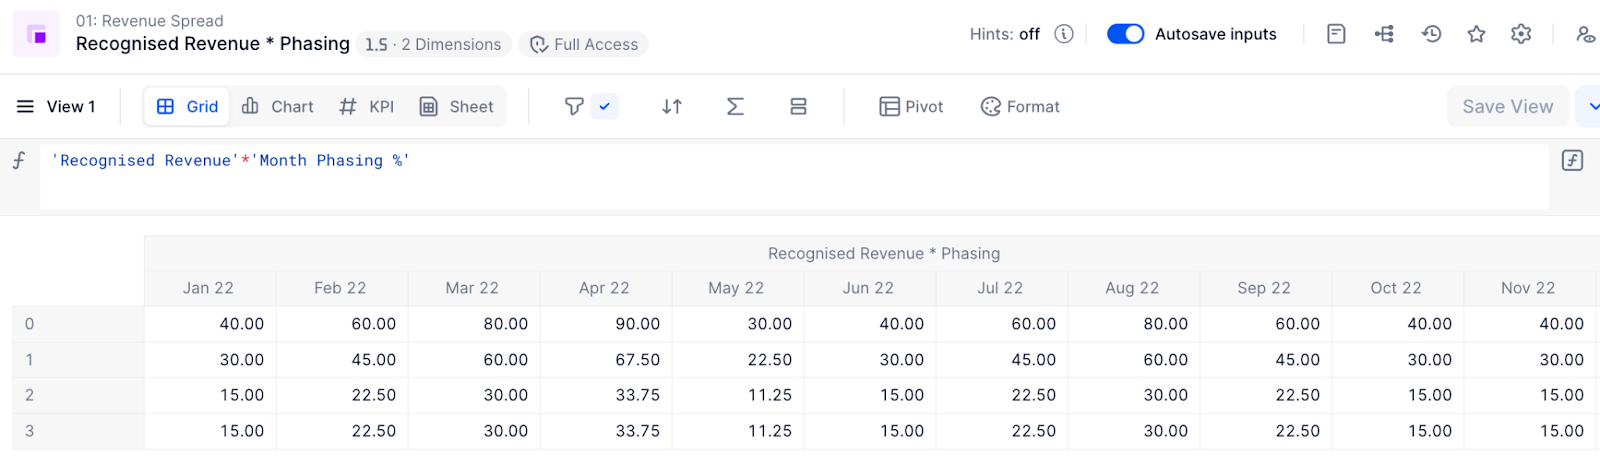
(i.e. the value in a given intersection is the multiplication between the Recognised Revenue for that month and the phasing % for the ‘Month(s) Delay’ list item).
STEP 4
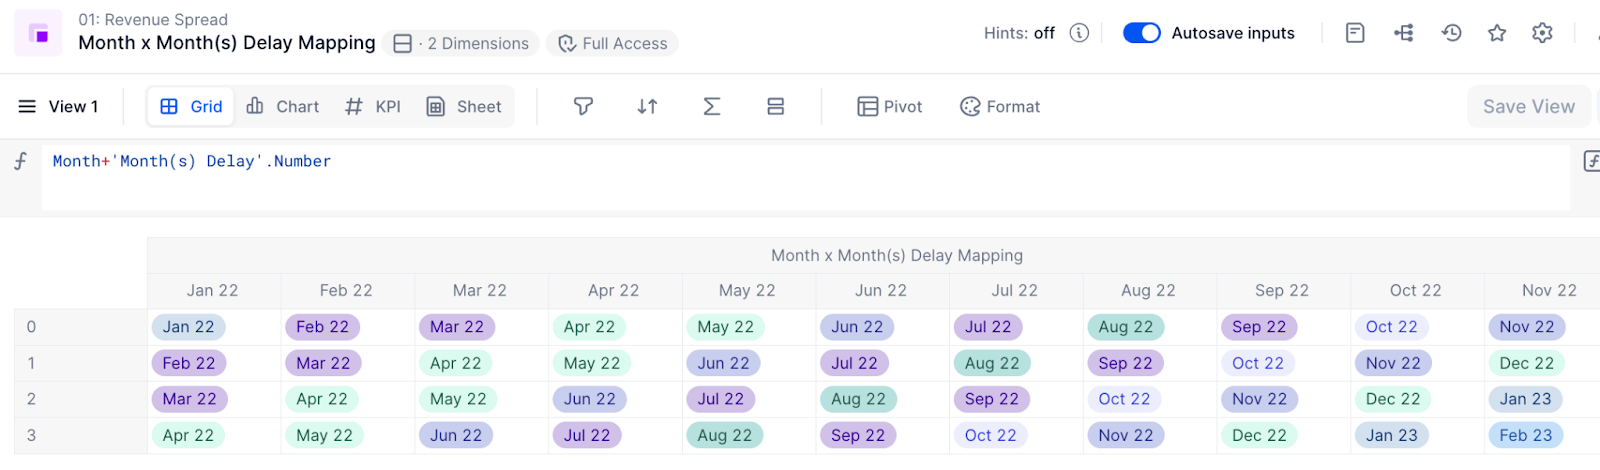
So the last metric we created gives us the phasing, but it doesn’t allocate the revenue to the target months. So how do we achieve this? Well, we know that - for the last metric we created - the value for a given intersection of Month x and ‘Month(s) Delay’ of y should be allocated to Month (x + y) (e.g. the value in the intersection of Jan 22 and 2 Month(s) Delay should be allocated to Mar 22). Hence, we have a rule to define how to do the allocation. Now let’s create a mapping metric based on said rule.
This new metric will be dimensioned by Month and ‘Month(s) Delay’, and will have the data type of Dimension, where the dimension is Month. The formula should be
Month+'Month(s) Delay'.Number
where the Number property of the ‘Month(s) Delay’ dimension is the ‘Integer’ property we discussed earlier.
(SIDE NOTE: The property has to be an integer property because if you wish to create a formula where
List item a + x = List item b (where List item b is exactly x items after List item a)
then x MUST be an integer, i.e. a whole number.)
This should give you the following output.
STEP 5
We now have only one metric outstanding - the phased revenue output metric.
We know this needs to be dimensioned only by Month. We want to source from the ‘Recognised Revenue * Phasing’ metric, and map based on the ‘Month x Month(s) Delay Mapping’ metric.
So the formula is:
'Recognised Revenue * Phasing'[BY SUM: 'Month x Month(s) Delay Mapping']
(We do a ‘BY SUM’ here because this is an example of an aggregation, and the default behaviour of an aggregation is BY CONSTANT, whereas in this case we want to do a SUM. More info on the BY modifier here.)
You can then add metrics from Steps 2, 3 and 5 into a table to get a view similar to that in the screenshot below.
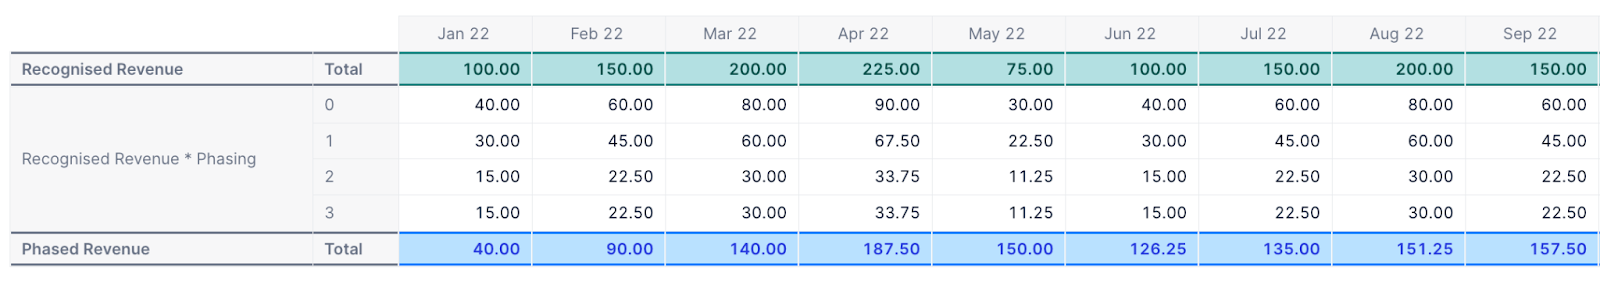
You can sum the numbers in the ‘Recognised Revenue * Phasing’ metric to check the numbers in the ‘Phased Revenue’ metric are correct. For instance, we know that the intersection of Jan 22 and 0 (40) should be the only number allocated to Jan 22, which it is. We also know that Feb 22 and 0 (60) should be allocated to Feb 22, as should Jan 22 and 1 (30). 60 + 30 = 90, which is what we have in our output metric for Feb 22, so it looks like it works!
Conclusion
I hope this guide has been helpful and easy to follow. It is possible that the phasing use case you need to model is more complicated than that of our example, but if you follow the core-principles explained in this article it should help you find a solution.
Happy modeling!
Matt