


At Pigment we understand that organizations need to quickly react and create models that’ll help them forecast their revenue based on some actual data. Often, what’s used is a Growth Rate hypothesis: the percentage change of a specific variable within a specific time period.
This is completely doable in Pigment in an efficient and easy way, below are the steps 👇
Table of contents
Step 1: Setting up Actual vs Forecast in Pigment
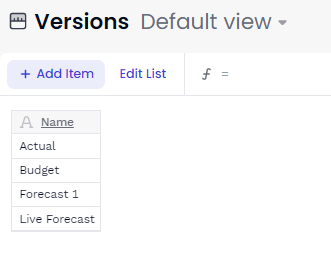
Firstly, we’ll create a Dimension called “Versions”. Here you can add items such as “Actual”, “Budget”, “Forecast 1”, “Live Forecast” and more if you wish.
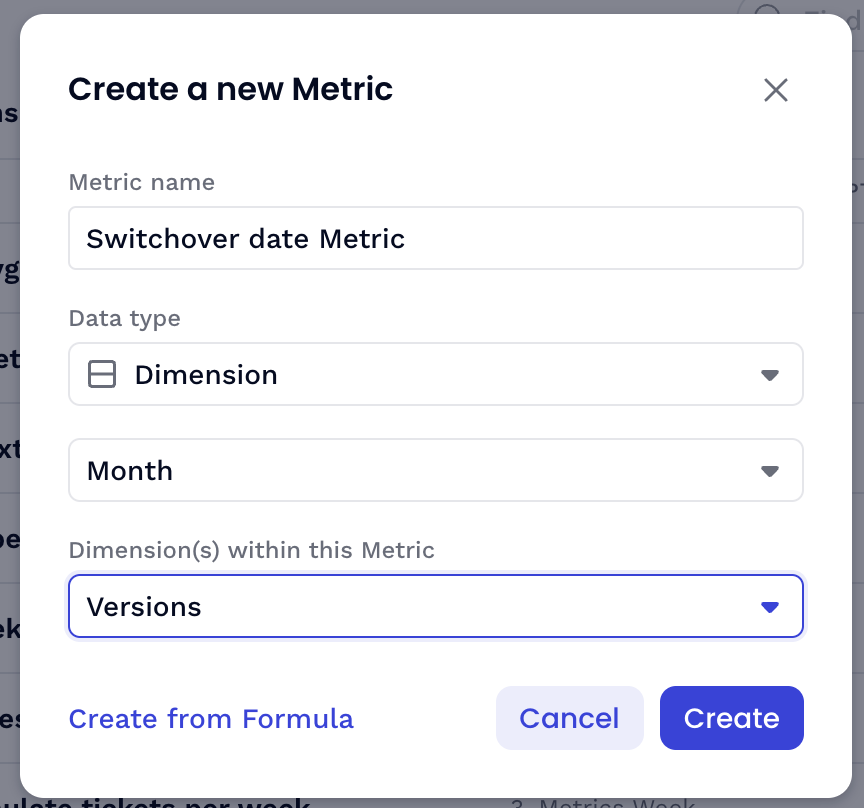
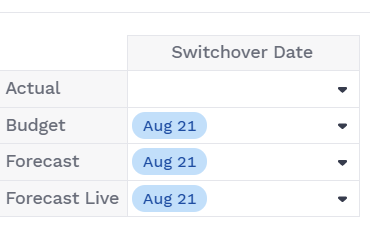
Secondly, we’ll need to create a ‘Switchover date’ Metric for your versions. For this exercise, we’ll want to use August 21 as our date that differentiates actuals vs forecast.
To do this you can create a Metric of type Month Dimension and with the Versions Dimension within its structure.
 |  |
Thirdly, we’ll create an IsActual Metric of type “Boolean” with Versions and Month Dimensions:
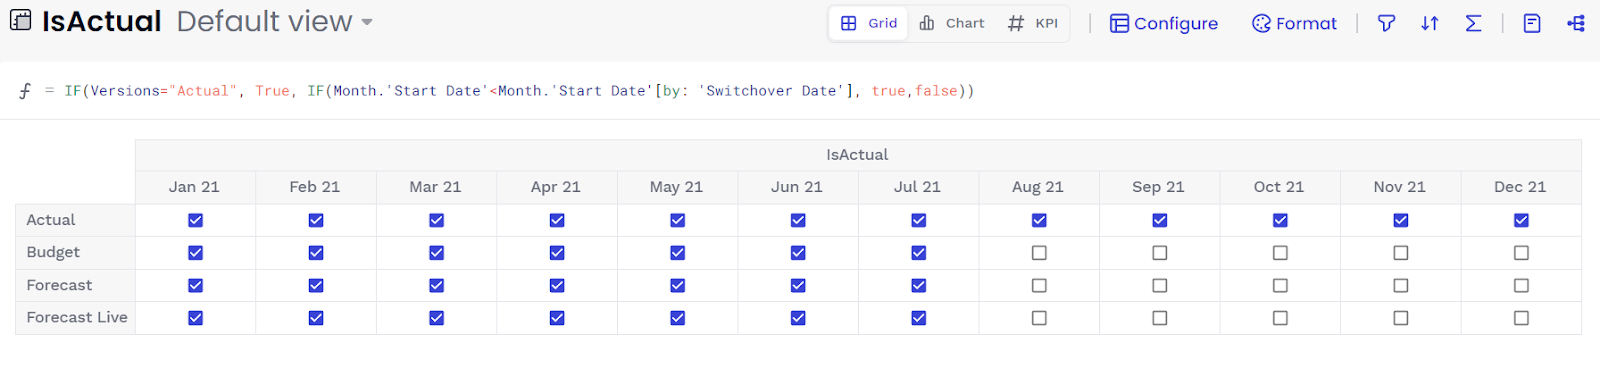
using this formula: IF(Versions="Actual", true, IF(Month.'Start Date'<Month.'Start Date'[by: 'Switchover Date'], true,false))
We are telling Pigment that if the Version is equal to Actual, then your box should be ticked, otherwise, if the property start date of the month Dimension is before the start date of the month of the switchover date by versions, also tick the box, otherwise leave it blank.
Step 2: Adding all the actual data
Now, you’ll need to create and set the layout Dimensions of your Application such as Country and Region for example. Then you can focus on creating Metrics.
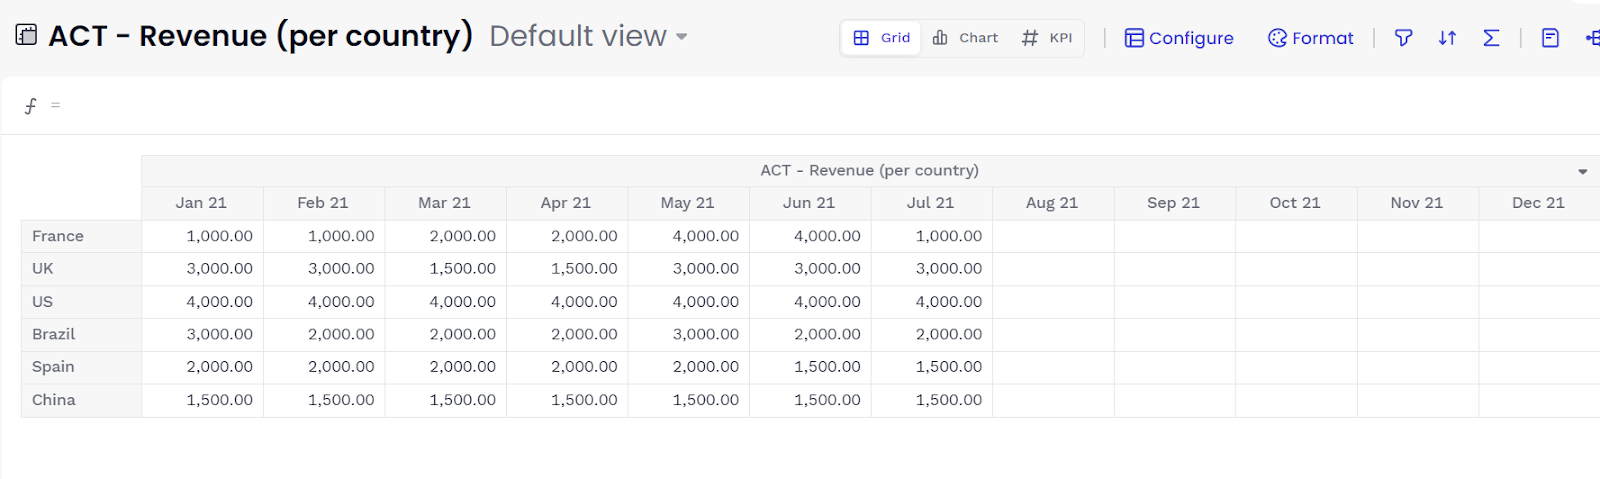
In this example below, we created a simple ’ACT - Revenue (per country)’ Metric with the corresponding actual data per Country Dimension. To add the data you can either input it manually, import it via a CSV file, or use our APIs for an automated computation.
Step 3: Create growth rate hypothesis by versions
To be able to forecast your revenue you can either input the data manually or base it off a growth rate to compute your data with. In this example, we’ll create a simple ‘Growth Rate Hypothesis’ Metric per Versions, Month and Country 👌
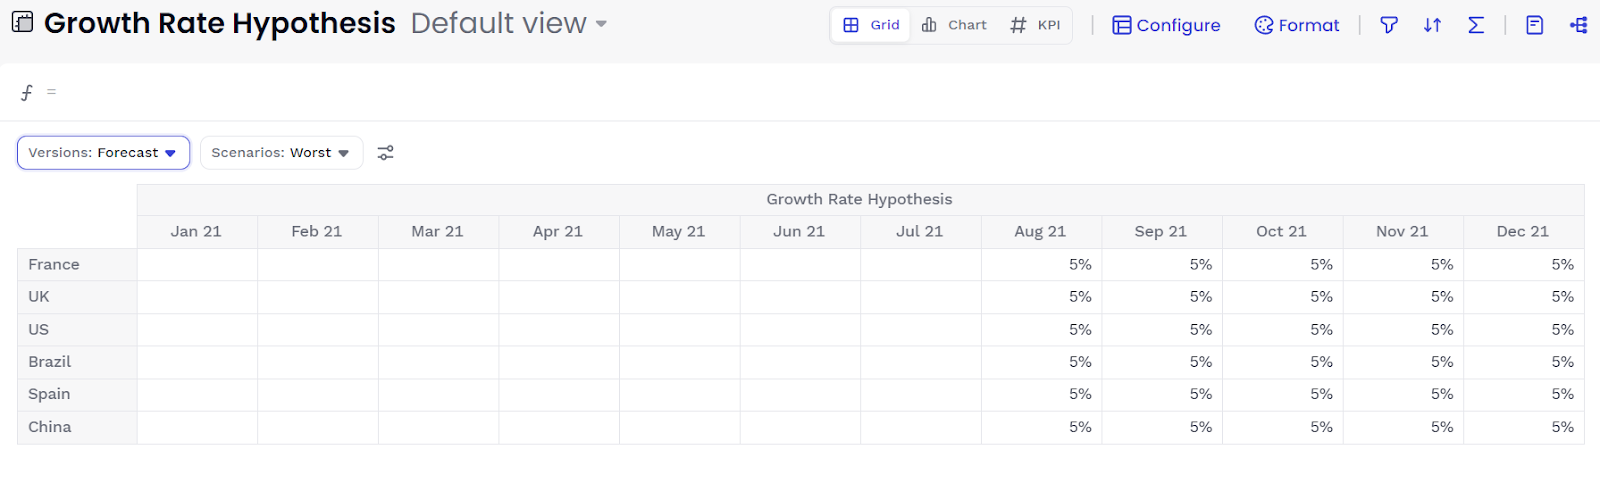
We will give a random rate to Forecast, Budget, and Forecast Live.
Step 4: Create your Forecasted Revenue Metric
Now that you’ve created your Growth Rate Hypothesis you’ll need to create a ‘FCST - Revenue’ Metric:
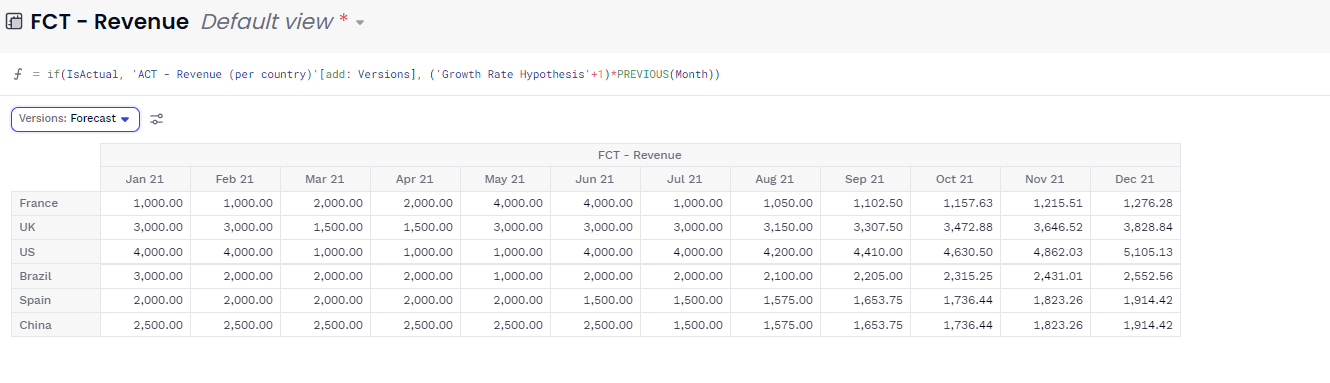
Formula: IF(IsActual, 'ACT - Revenue (per country)'[add:Versions],('Growth Rate Hypothesis'+1)*PREVIOUS(Month))
We are telling Pigment that if your data is Actual, then Pigment should display the ’ACT - Revenue (per country)’ Metric (making sure to add the Versions Dimension), otherwise display the result of your ’Growth Rate Hypothesis’ Metric +1 multiplied by the previous month.
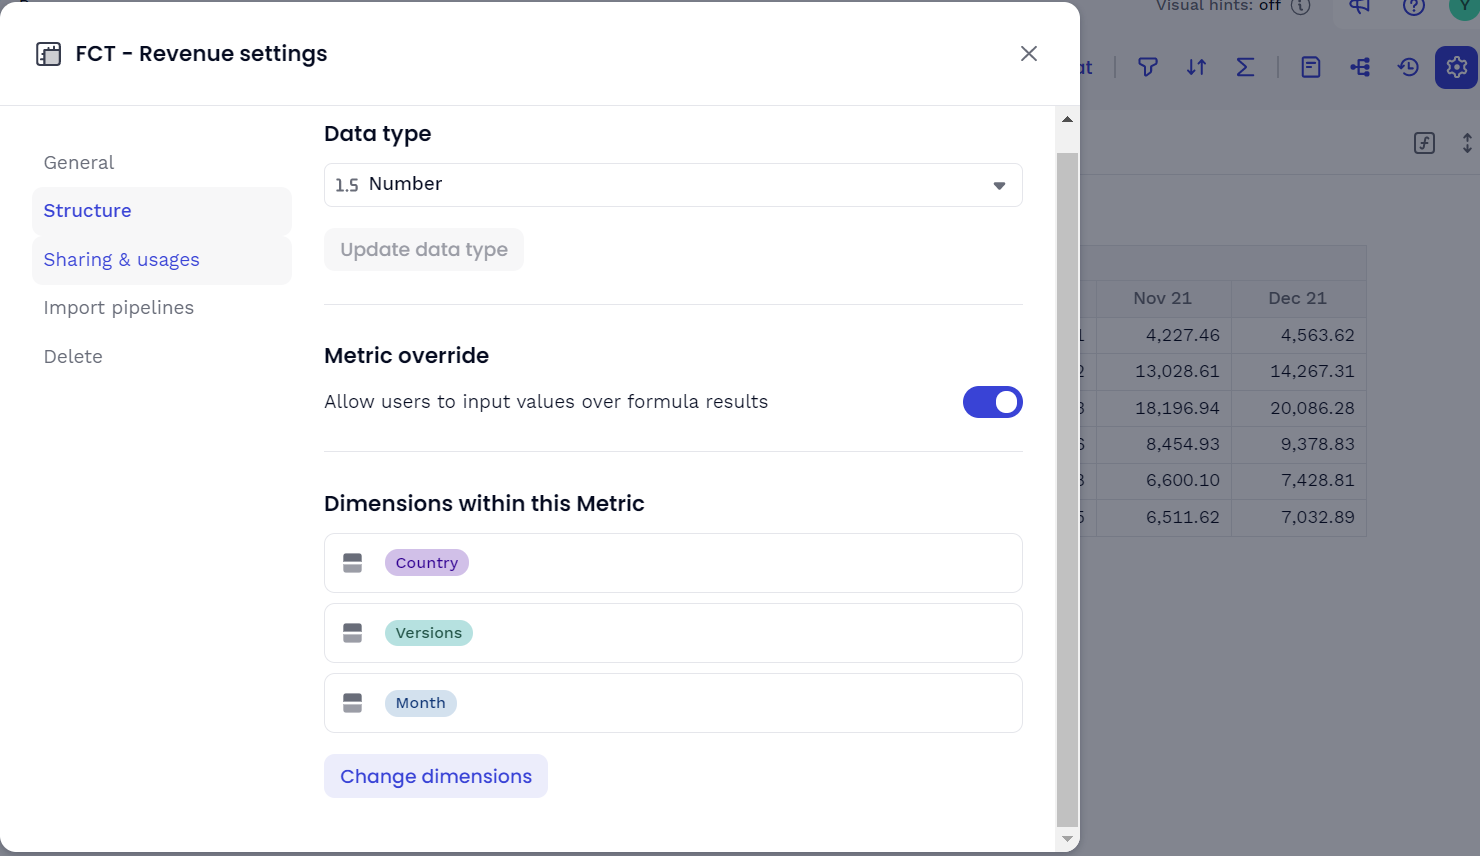
Don’t forget to allow your users to override the formula. Especially for the Forecasted Live version. In order to do so, you’ll need to go to Settings > Structure: Metric override.
You can now play with the different values and modify them based on their case Dimensions👋
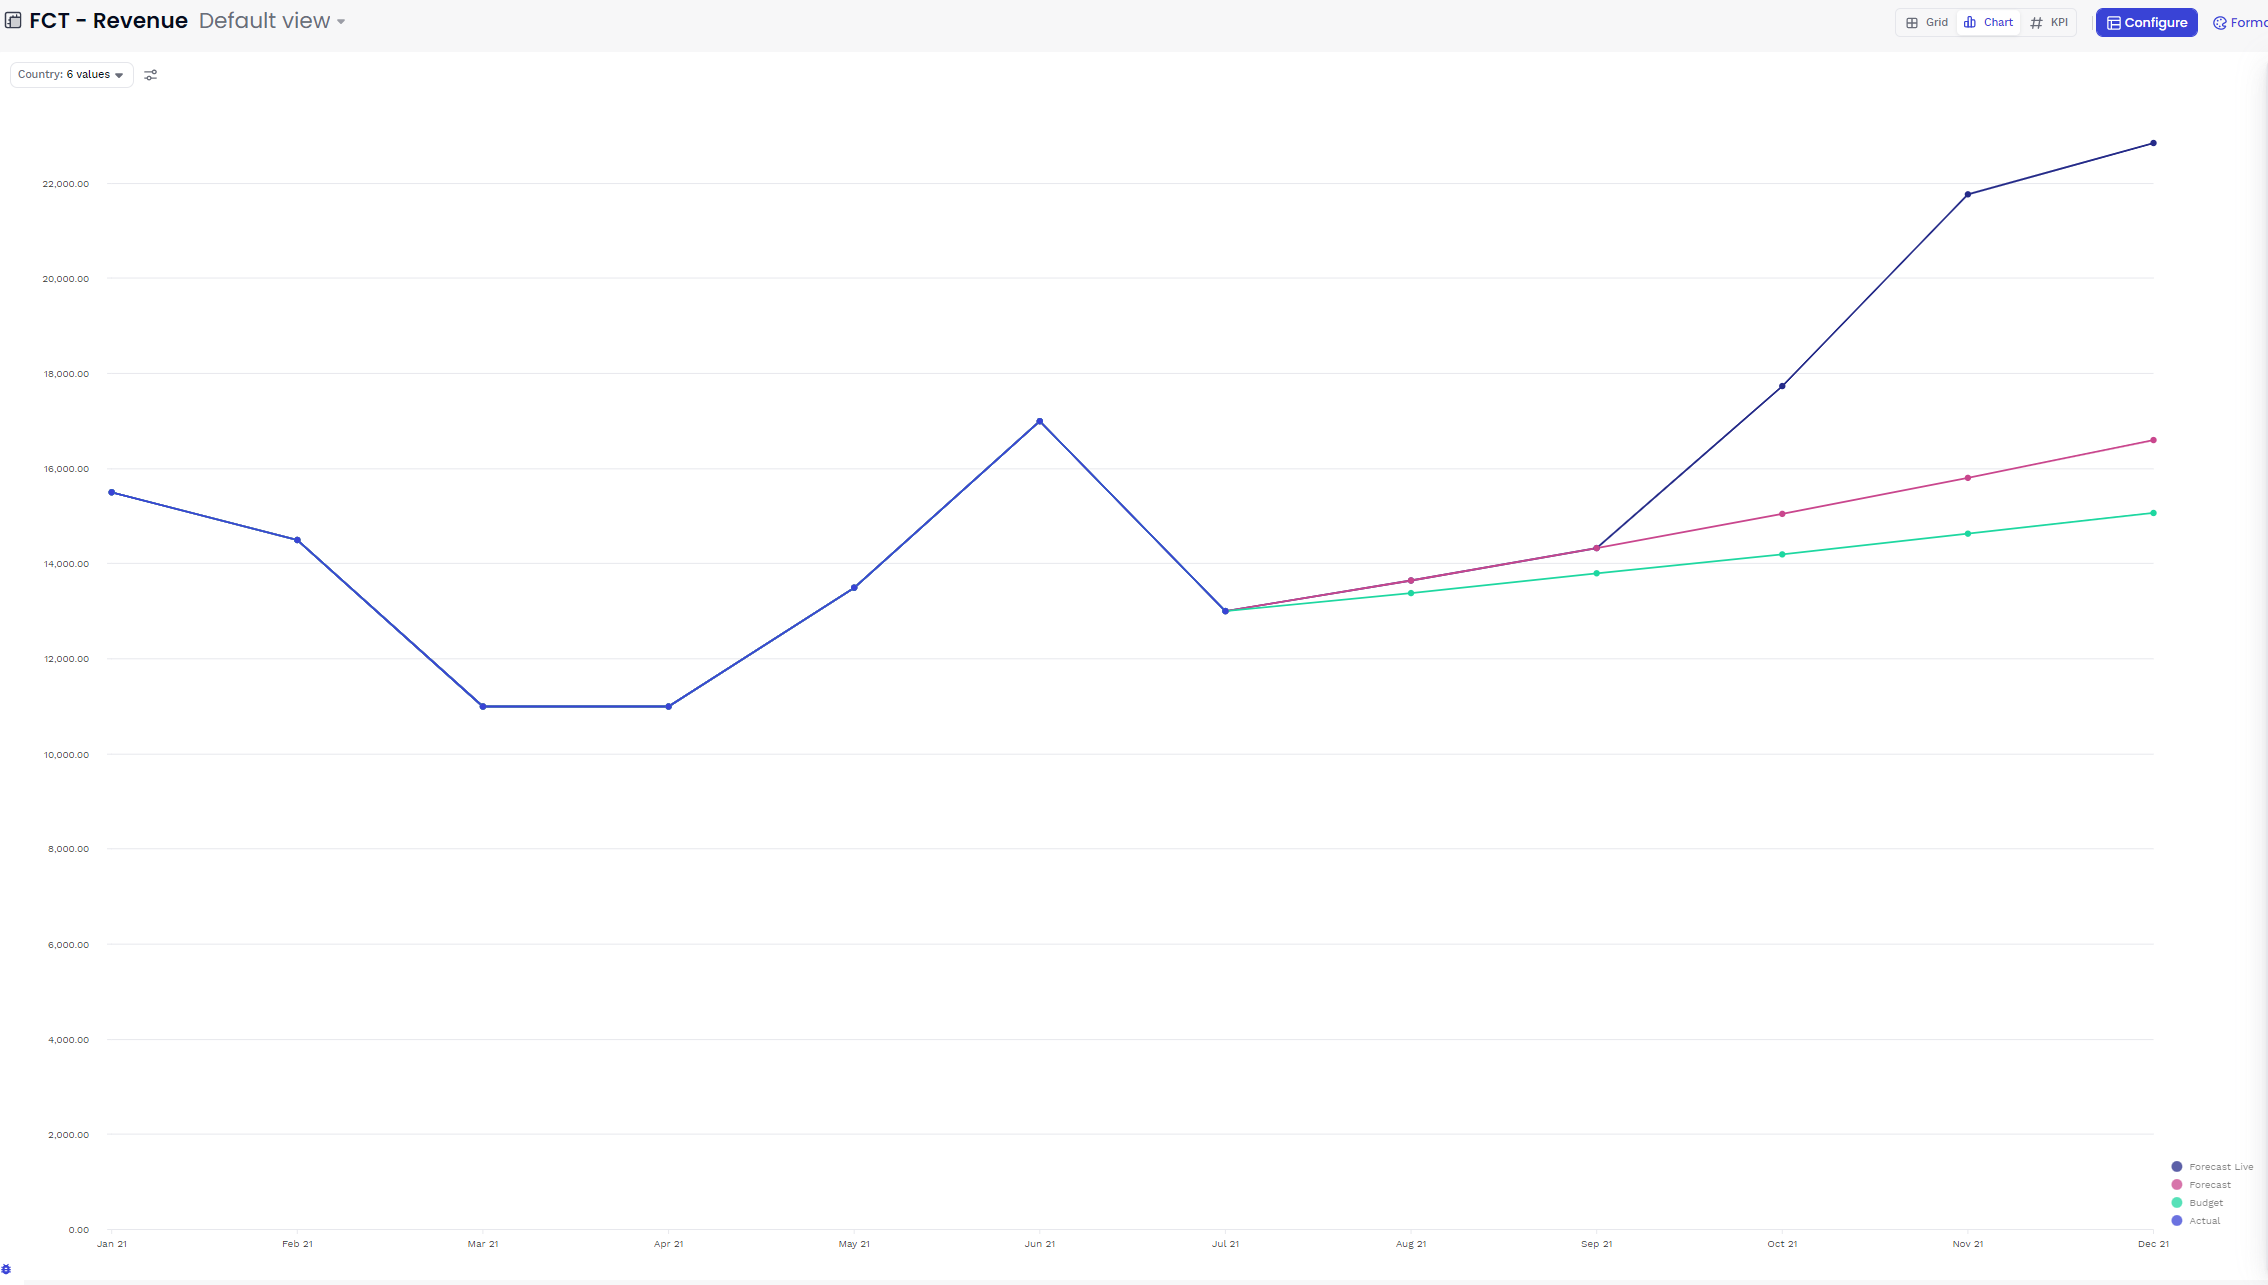
Finally, use a Formatted view in Line Chart to be able to instantly compare these versions you just created.
Extra tips 🚀
-
You can use our Visual Hints Feature to quickly understand which value has been calculated or overridden 👀
-
Don’t forget to create a chart view to be presented to your team and add it to your Boards. Use the Format section to play with colors, display options, type of charts etc.
-
Create folders accordingly for all the blocks that will be similar.
-
For each Metric try to have a naming convention: ie. ACT (for Actuals) / FCST (Forecast) / REV (Revenue).