


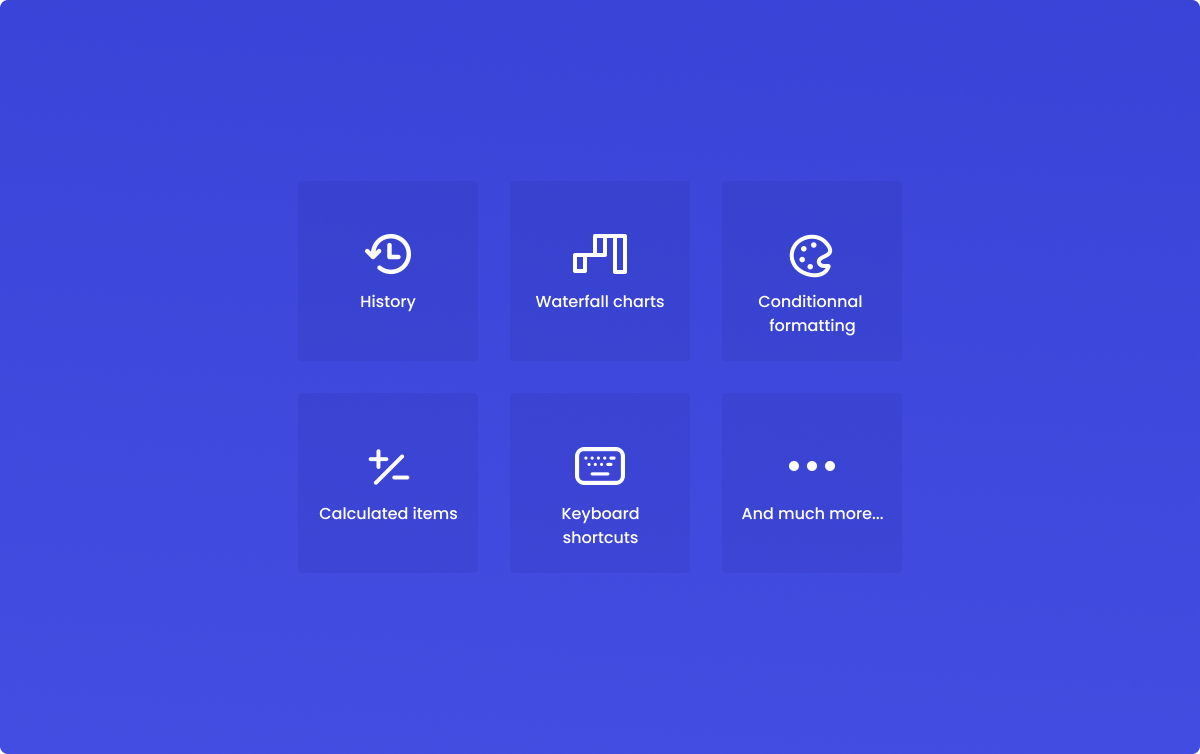
Application History, Waterfall Charts and a lot more!
Published: April 3rd 2021
Hi Friends,
At Pigment, we're always thinking about how to ease the Planning and Reporting activities of your team in ways no other tool has done before.
Our teams have been hard at work to deliver on this promise for the past three months and we couldn't be more excited to tell you about some of the new features we’ve shipped to make your every day even lighter.
Curious to know what lies ahead? We’re also giving a sneak peek at our plans for the current quarter at the end of the newsletter.
Application History – Tracking changes like Sherlock Holmes
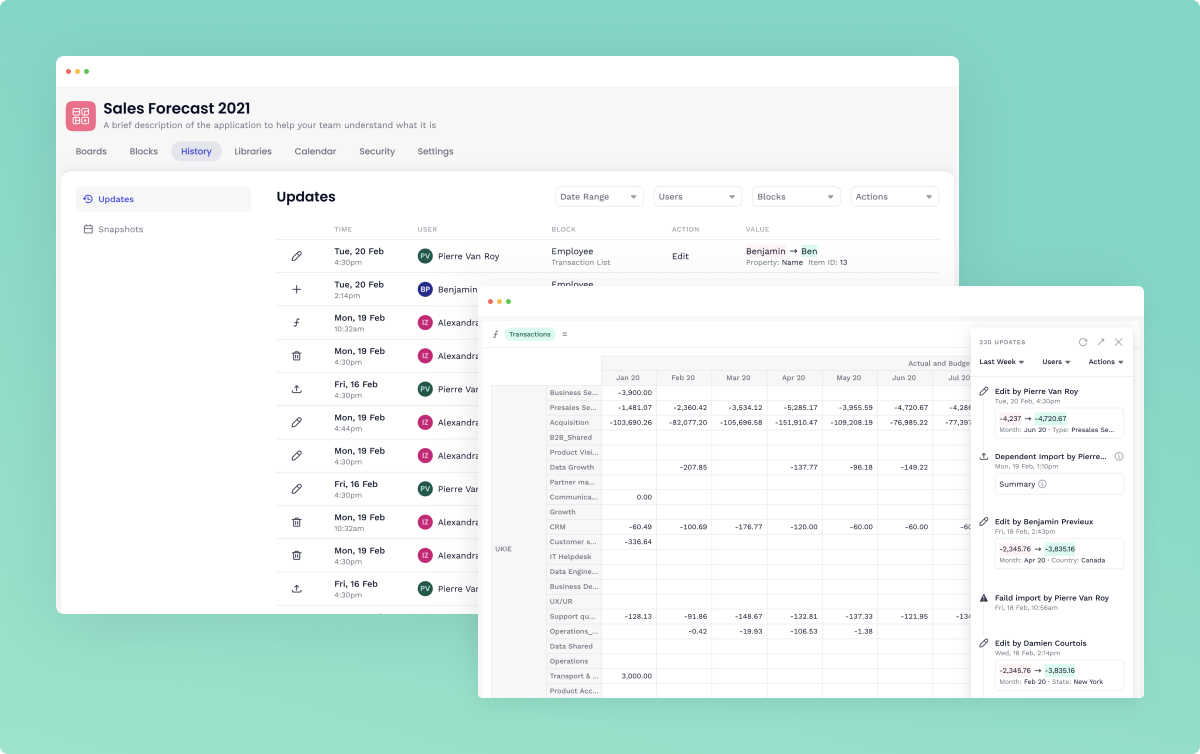
Have you ever spent a day trying to understand why your data has changed, only to find out the culprit was yourself two days ago? Auditing numbers and tracking changes are a must-have in any planning solution. Yet, how many do it well?
At Pigment, we believe such a critical piece should be more readable than a text-based adventure game from the 90s. We made it central to our platform: available from anywhere, interactive, highly detailed, and smartly organized.
The best part? This is just the beginning and with your feedback, we keep improving it every day!
Learn more
Waterfall Charts – Variance analysis made elegant and simple
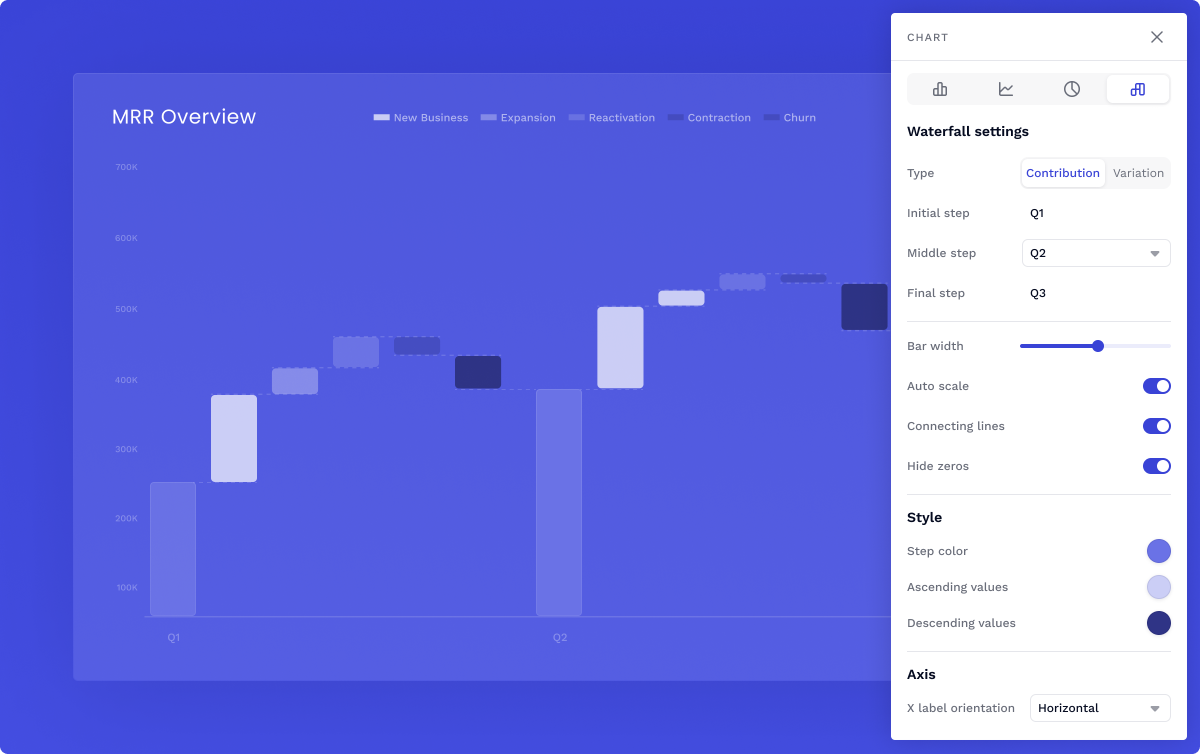
How many headaches have you experienced trying to build a clean and beautiful variance analysis for a presentation that was due in less than one hour?
Waterfall charts are here to get it done! Because the beauty of a visual explanation wins over any wall of text, we wanted to give them to you natively within Pigment. Thanks to their extreme simplicity and automatic calculations, presenting how your plan has changed over time or versions has never been easier - a matter of seconds, really. Learn more
Calculated Items – Calculations and ratios out of the box
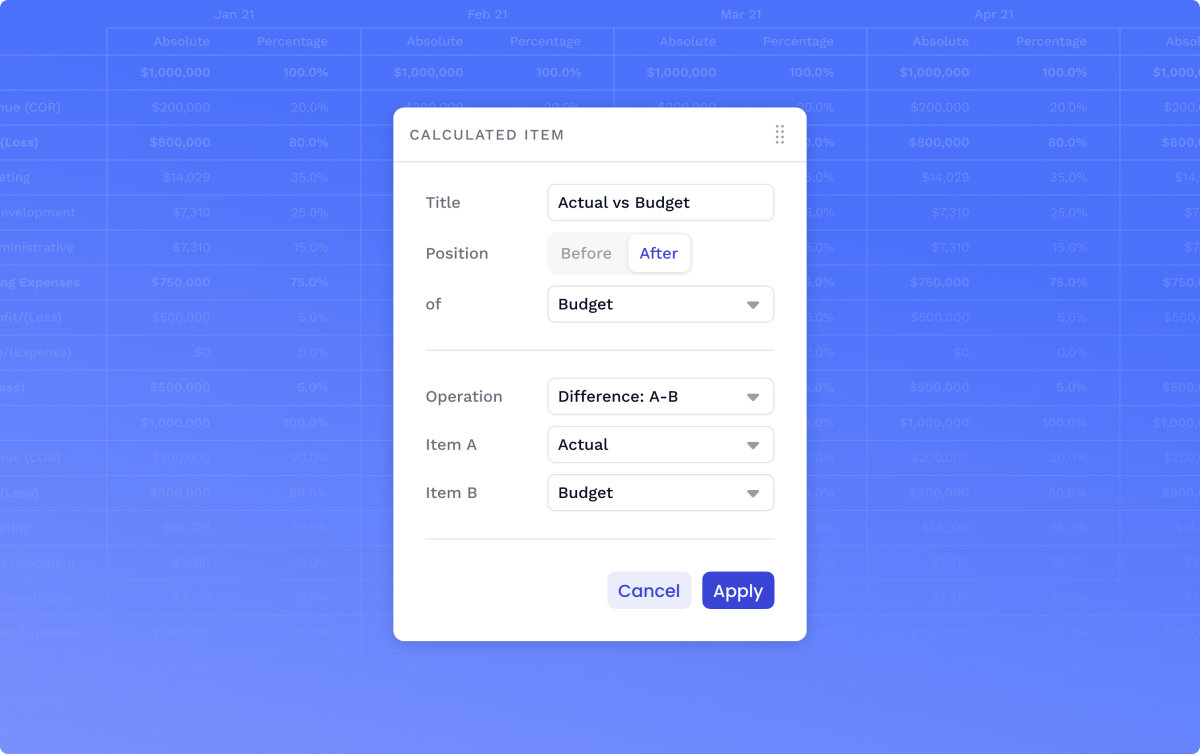
We're often shocked by the amount of complex modelling that competing solutions require to do simple calculations. We think that you should never have to write a single formula to add variances and ratios to your reports. Well, now you won’t have to. Simply right-click on the dimension of your choice to add calculated items to your models. YoY Growth and Budget Variance will now be a breeze, you're welcome!
Learn more 20+ other delightful updates:
- Conditional Formatting
- Google Sheet Connector
- New Block Explorer
- Block Tooltip
- Keyboard Shortcuts
- ... and more!
What are your summer plans? Here are ours:
As you might be heading into a well-deserved summer holiday, sit back and relax while we continue to make Pigment even easier to use.
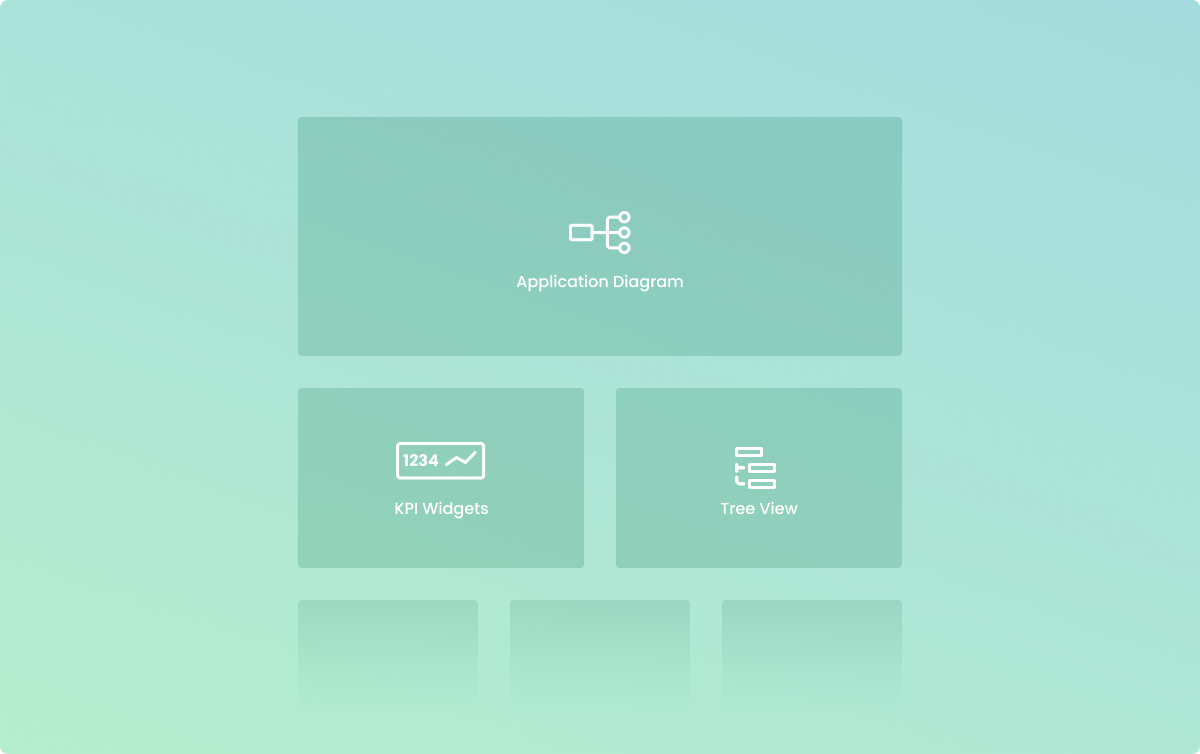
You'll be able to seamlessly navigate your application thanks to the Application Diagram we're building, to break down your reports even further, and to put it all together in a powerful way thanks to our brand new Tree View and KPI widgets. See the full list of features Thanks for reading We hope this made you as excited as we are! We cannot wait to hear your feedback on the new and upcoming features. We're always looking to improve so please don't be shy and share your comments via e-mail or by contacting your Customer Success Manager.
The Pigment Team