


 Pigment Community is here
  Check out the top 5 reasons you should join!
Published: March 30th 2022

Hi Friends,
A lot has changed since we last chatted, in our product, but also in the ways we can communicate! We launched our new community, it's a great place for Pigment users to get together and discuss all things Pigment. I put together some compelling reasons to join below. We also made a bunch of improvements to Pigment, you can also check out some of my favorites highlighted in our Product Updates section.
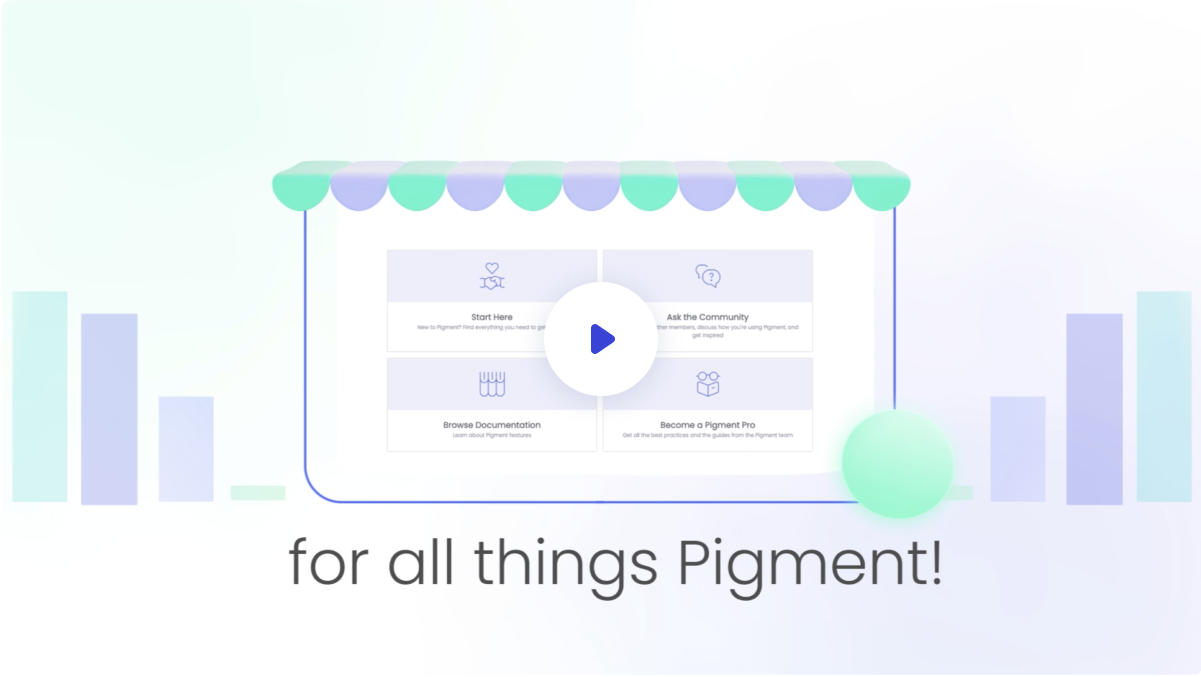
Check out our community preview video!
Community
- Make Connections!
No, I'm not talking about data integration connections. However, we did just release ones for Salesforce, Netsuite, BigQuery, Looker, and Workday! I am talking about connecting with other Pigment users. Start by Introducing yourself, Spoiler alert, I posted a picture of my adorable puppy.
- All the latest best practices are here!
Our team of experienced model builders are always learning new tricks and we love to share them. My personal favorite is by my friend Nathan, Setting Up User Access: The Complete Practical Guide, it helped me set up my Application security.
- Documentation, Documentation, Documentation
Unsure how a particular feature works or want to see some more information about functions? You can find all of that in our Knowledge Base. Speaking of functions, did you see we just launched some new ones?
- SUBSTITUTE
- STARTOFMONTH
- MOVINGAVERAGE
- DATEVALUE
- MOVINGSUM
- SHIFT
- ISDEFINED
- Be prepared and help shape the future
I am sure you have seen our notifications in the top left corner, where we host our changelog but have you checked our Product Roadmap? You can see planned functionality and even vote on its importance and let us know why. You can also read about upcoming changes, our new Sidebar navigation article has images of the anticipated upgrades.
- Learn from industry leaders
Check out our events section to be able to sign up for Webinars and hear how other customers are using Pigment to help with their planning. We have quite a few planned!
Can't find what you are looking for? Click the Create Topic to ask a question or have a conversation with your peers. We look forward to hearing from you!
Product Updates
We have had quite a few updates since we last talked, more than those integrations and functions I mentioned earlier. Here is just a highlight of some of our favorites.
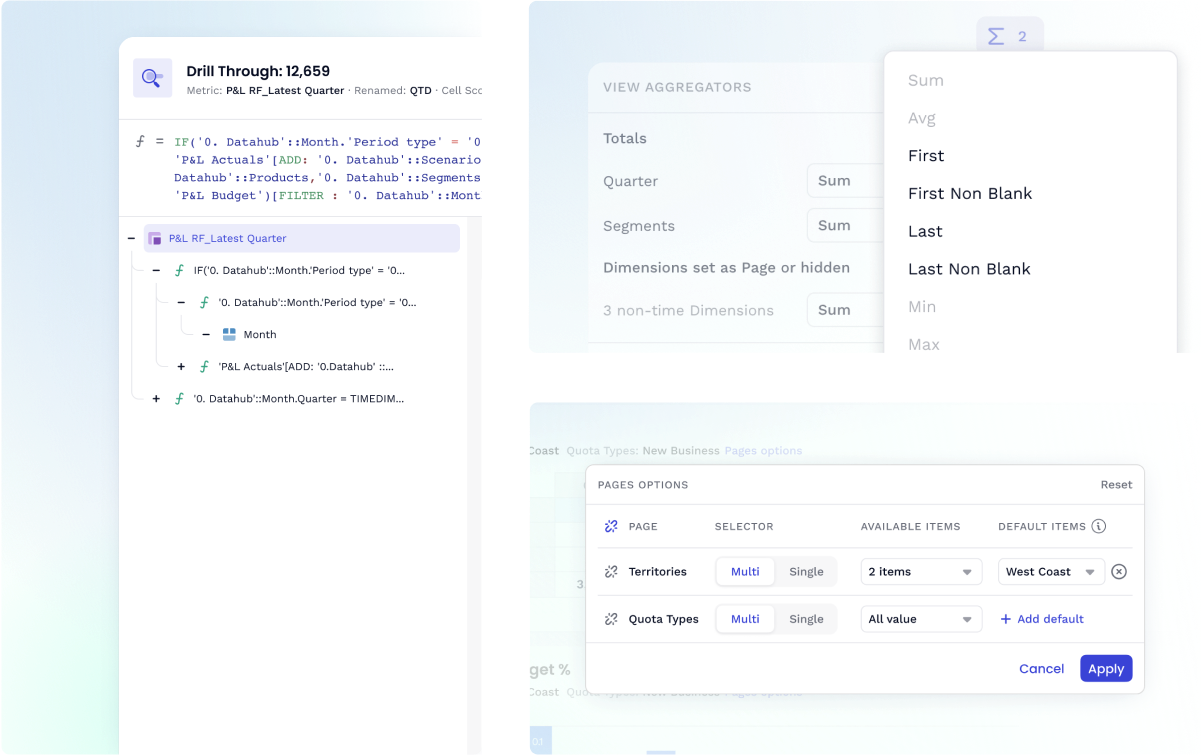
- We added 4 new sub-totals in the View Aggregators panel
FIRST, LAST, FIRSTNONBLANK and LASTNONBLANK. Displaying the opening and closing balance is now a few clicks away.
- Formula-free time calculations are only a few clicks away!
Calculating YeartoDate, YearOverYear growth, Actuals vs Last year and many more common time calculation, that were also time consuming, can now be done formula free and in seconds. We are extremely excited to announce new Offset and Cumulate functionalities in both Calculated Items and Show Value As!
- Boards have become much more customizable with our upgrade to Page Selectors
Now you can choose between single or multiple page selectors per dimension on board widgets. Allowing you to combine items or view one at a time. We have also added the ability to unlink widgets, this allows you to either synchronize widgets or view them separately. For example, maybe you want to look at a grid for one country, but don't necessarily want the chart to switch to that country.
Chart Updates
We've had so many Chart upgrades I put them in their own section.
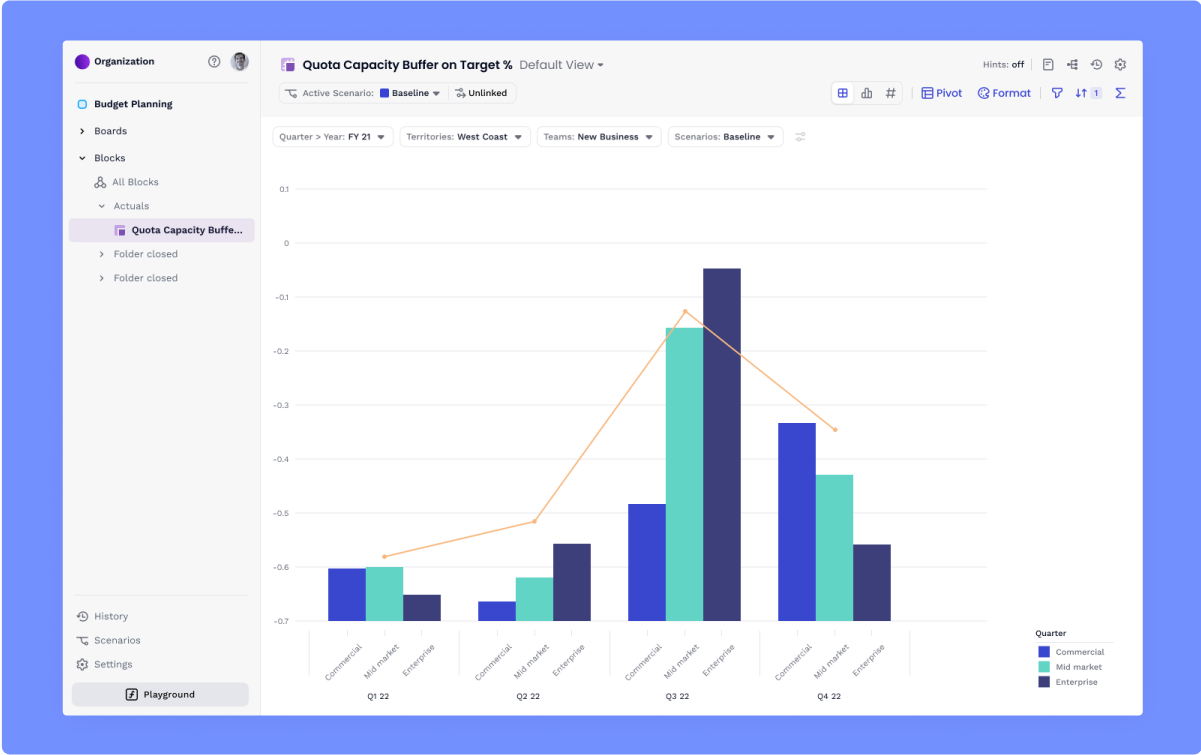
- Combined Charts
Combined charts are now available and have a secondary axis. Identify trends easier by combining two charts into one. The secondary axis allows you to scale multiple metrics together.
- Sorting on Charts
Sorting can now be applied to your charts, making it easier to identify top performers.
- Grouped Dimensions in Charts
You can now add more than one dimension per axis on charts. Test it out, put your months and quarters in a chart to see how much easier it is to visualize your data.
- Calculated Items
Calculated items are a great way to compare items within a dimension, now you can publish that in a chart to tell a better story.
Want to catch up on previous newsletters?
We will be posting all of our previous newsletters in the community you can find them here. We're always looking to improve so please don't be shy and share your comments via e-mail, by contacting your Customer Success Manager, or tag me in any community discussions!
Thanks,
Chris from Pigment