


Time flies when you are having fun and we have had a lot of fun this quarter. Lets take a look back at the product releases from the Q2 FY2022.
Table of Contents
User Experience
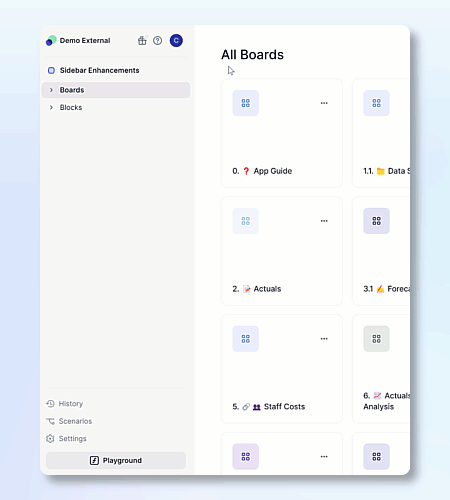
Sidebar enhancements
There has been huge improvements made in the Sidebar. Since its initial release at the end of Q1, we started by adding the ability for creating folders, then we added creating blocks. Following that was the ability to drag and drop to resize as well as to be able to drag blocks into those newly created folder. The navigation then went to the workspace level, here we added the ability to search for and create new applications, as well as return back to the workspace level. Read more about sidebar enhancements.
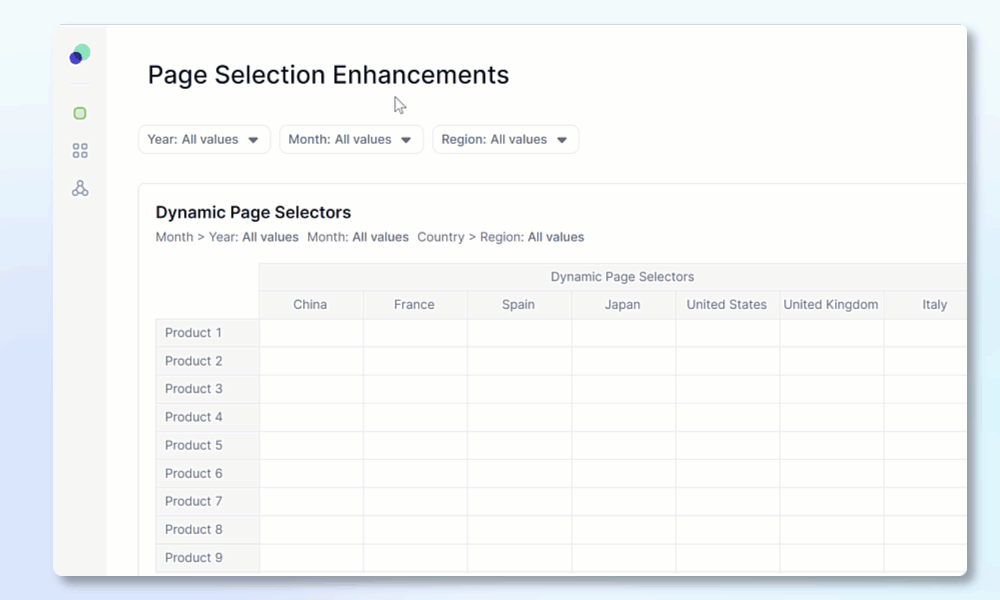
Dynamic Page Selectors
We made a few enhancements on how users update their page selections. We started with dynamic page selection, a functionality designed to update page selection options dynamically depending on choices made on another page selector that is grouped together. An example would be selecting the year 2022 and only seeing months for that year.
We also added the ability for users to X out a selection on an individual page selectors to return to the default or reset all page selections to the default by selectin Reset next to the page selectors.
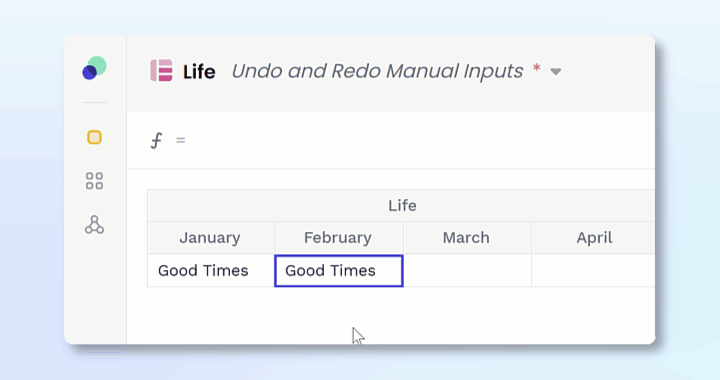
Undo/Redo
We added two new keyboard shortcuts for data input.
- press cmd/ctrl + Z to undo any manually input data entry.
- press cmd/ctrl + Y to redo any previous manually input entries that were erased using the undo shortcut
Cell Stats
One of the most used functionalities that was released is the ability to highlight cells to get a count of how many, as well as the sum and average of numerical values.
Easy modeling and reporting
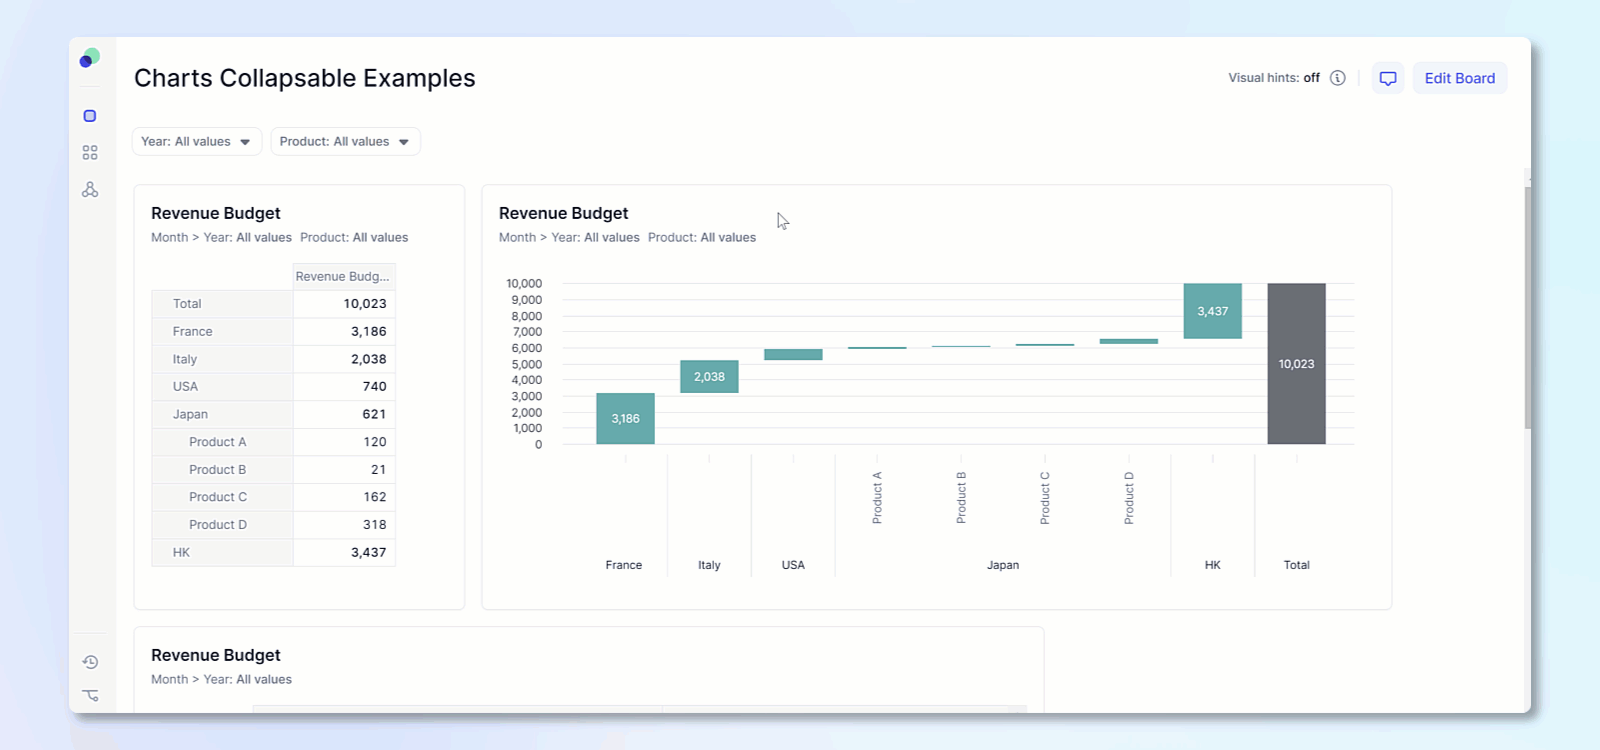
Waterfall Chart updates
Waterfall charts had two specific upgrades. When editing a board, you can easily adjust the values that are shown by expanding and collapsing to show which details to drill into. In order for this to work properly, make sure your grid is in tree view and you are in edit board mode.
You can also automatically balance waterfall charts by selecting the Balance data option. This will automatically fill in any gaps between in data being displayed in a waterfall chart.
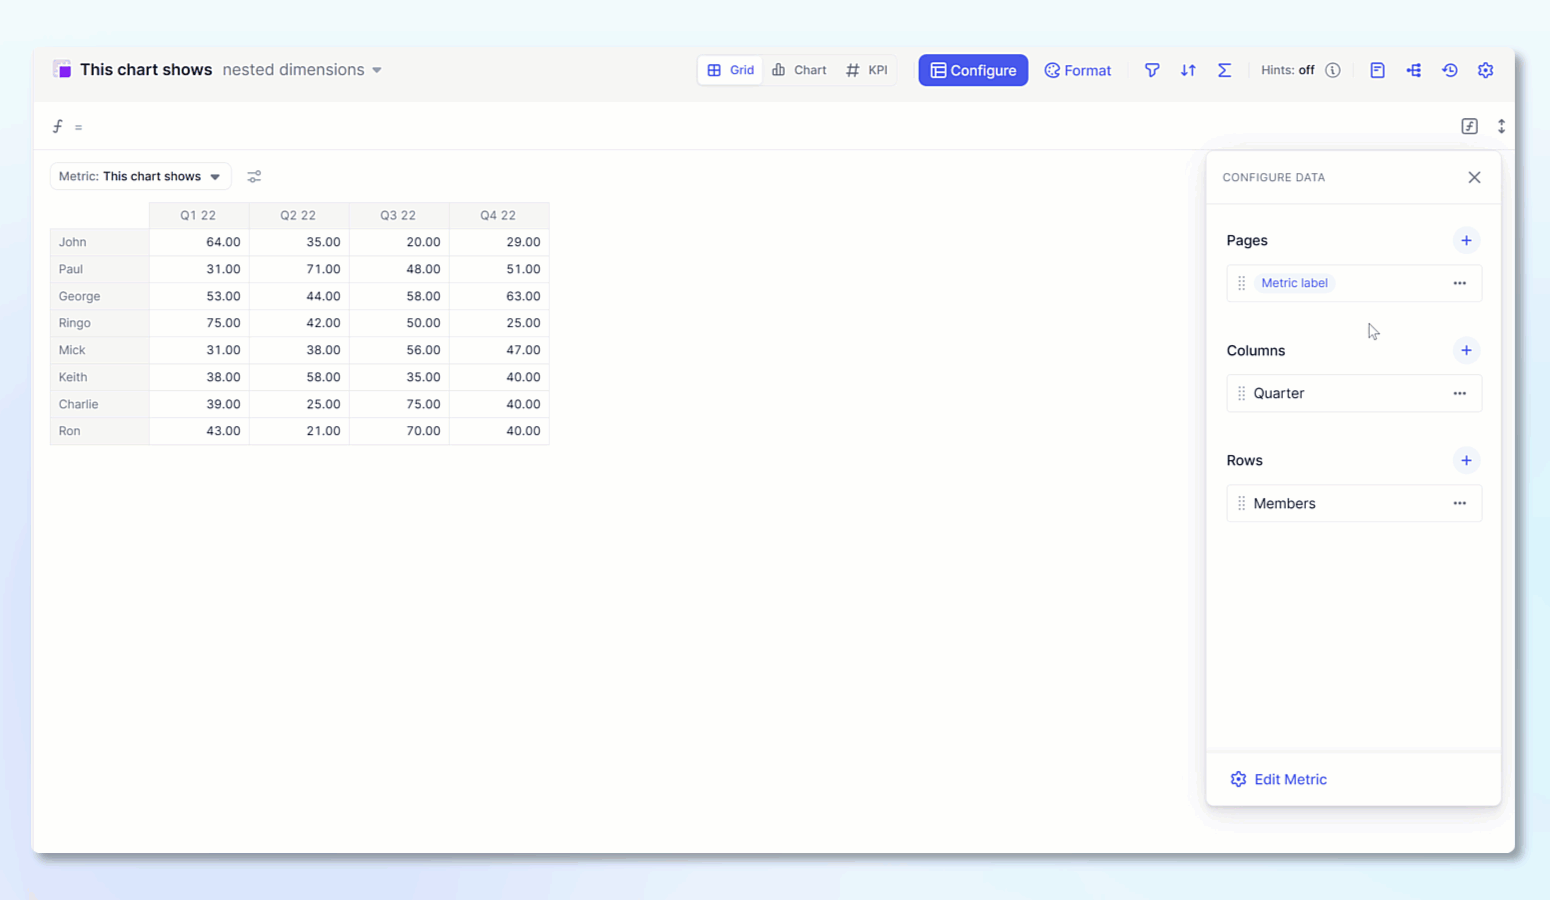
Multi-dimensional axis charts
There is no longer a limit of one dimension per axis on charts, meaning you can now have charts with multiple dimensions per axis. On top of this enhancement, there has also been upgraded nested labels on these charts.
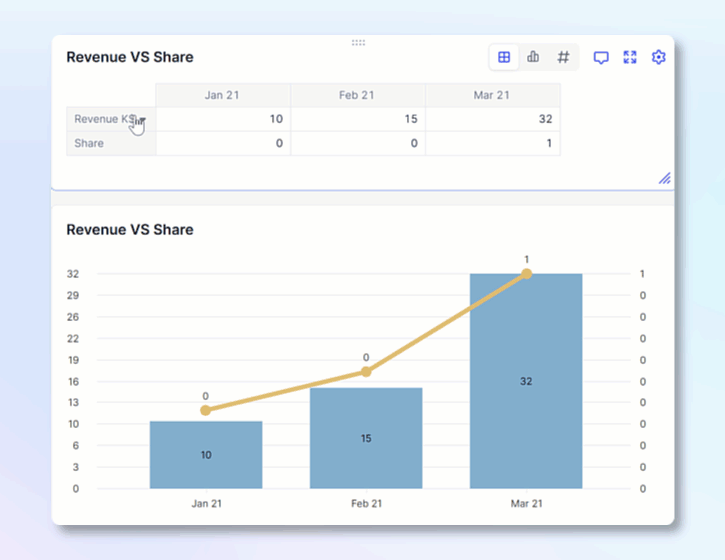
Formatting on charts
When working with charts, especially combined charts, your data might have multiple formats. Now charts are able to support these. This means the formatting on cell will be the same when displayed on a chart.
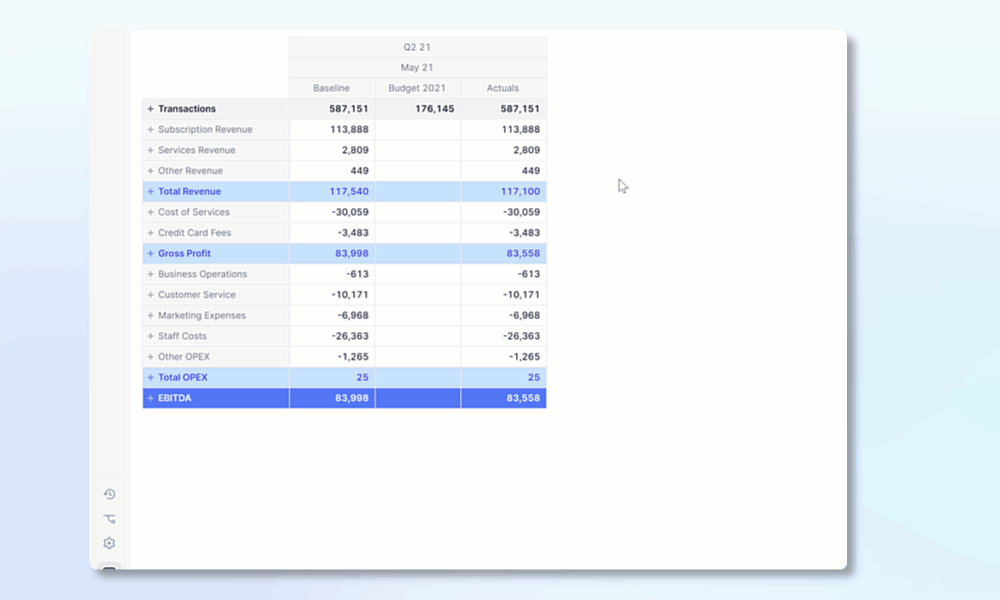
Formula free calculation updates
Calculated Items and Show value as have increased their capabilities by adding allowing to cumulate data forward and backwards. There have also been improvements made to offsetting values, similar to cumulate you can now offset back and forward.
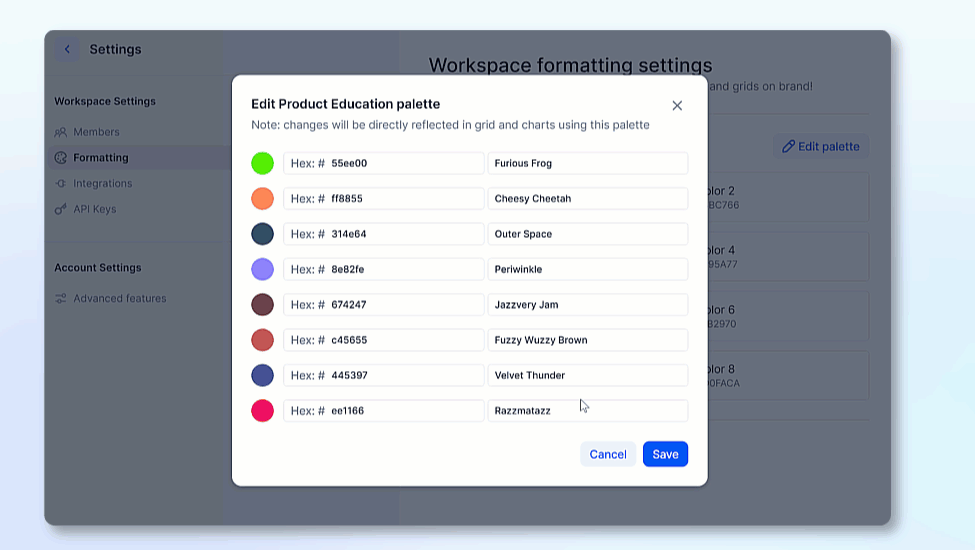
Color Palette
Workspace admins can now create a new custom color palette to be used in their charts and grids. There is one custom color palette per workspace, this makes it much easier to brand all your boards!
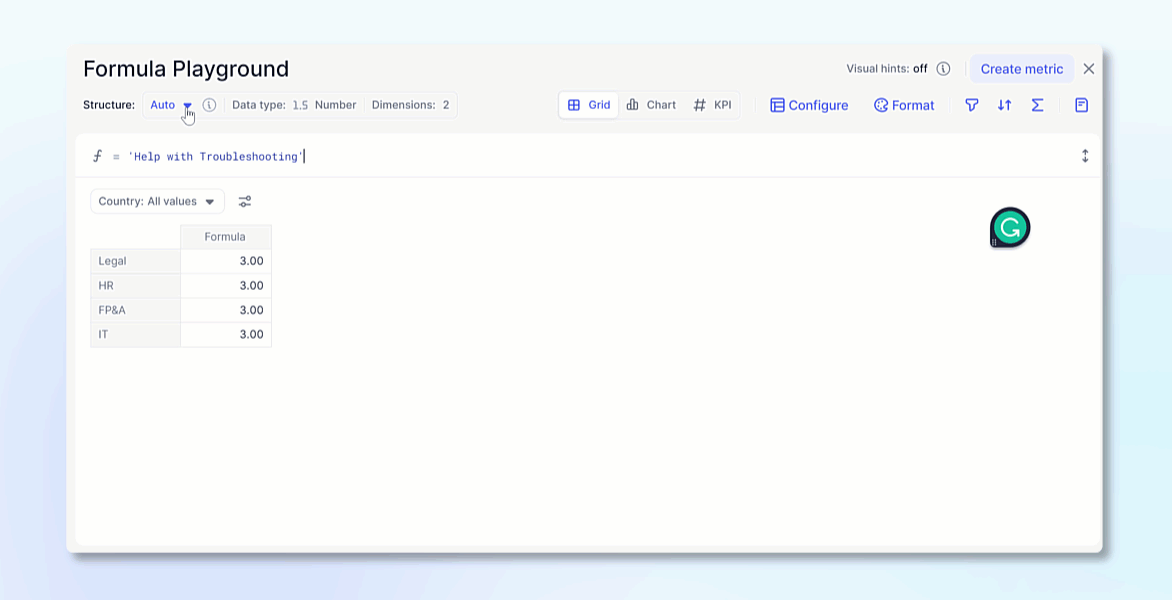
Custom mode in Formula Playground
You can now access Custom mode in formula playground, this will allow you to make manual adjustments to the dimensionality and data type. It makes it easier to troubleshoot formulas that need to meet a specific structure .
Format Multiple Metrics
When formatting metrics or properties, you can apply the same formatting to multiple metrics at once. Simply use the dropdown under Static formatting and select all the metrics you want to use.
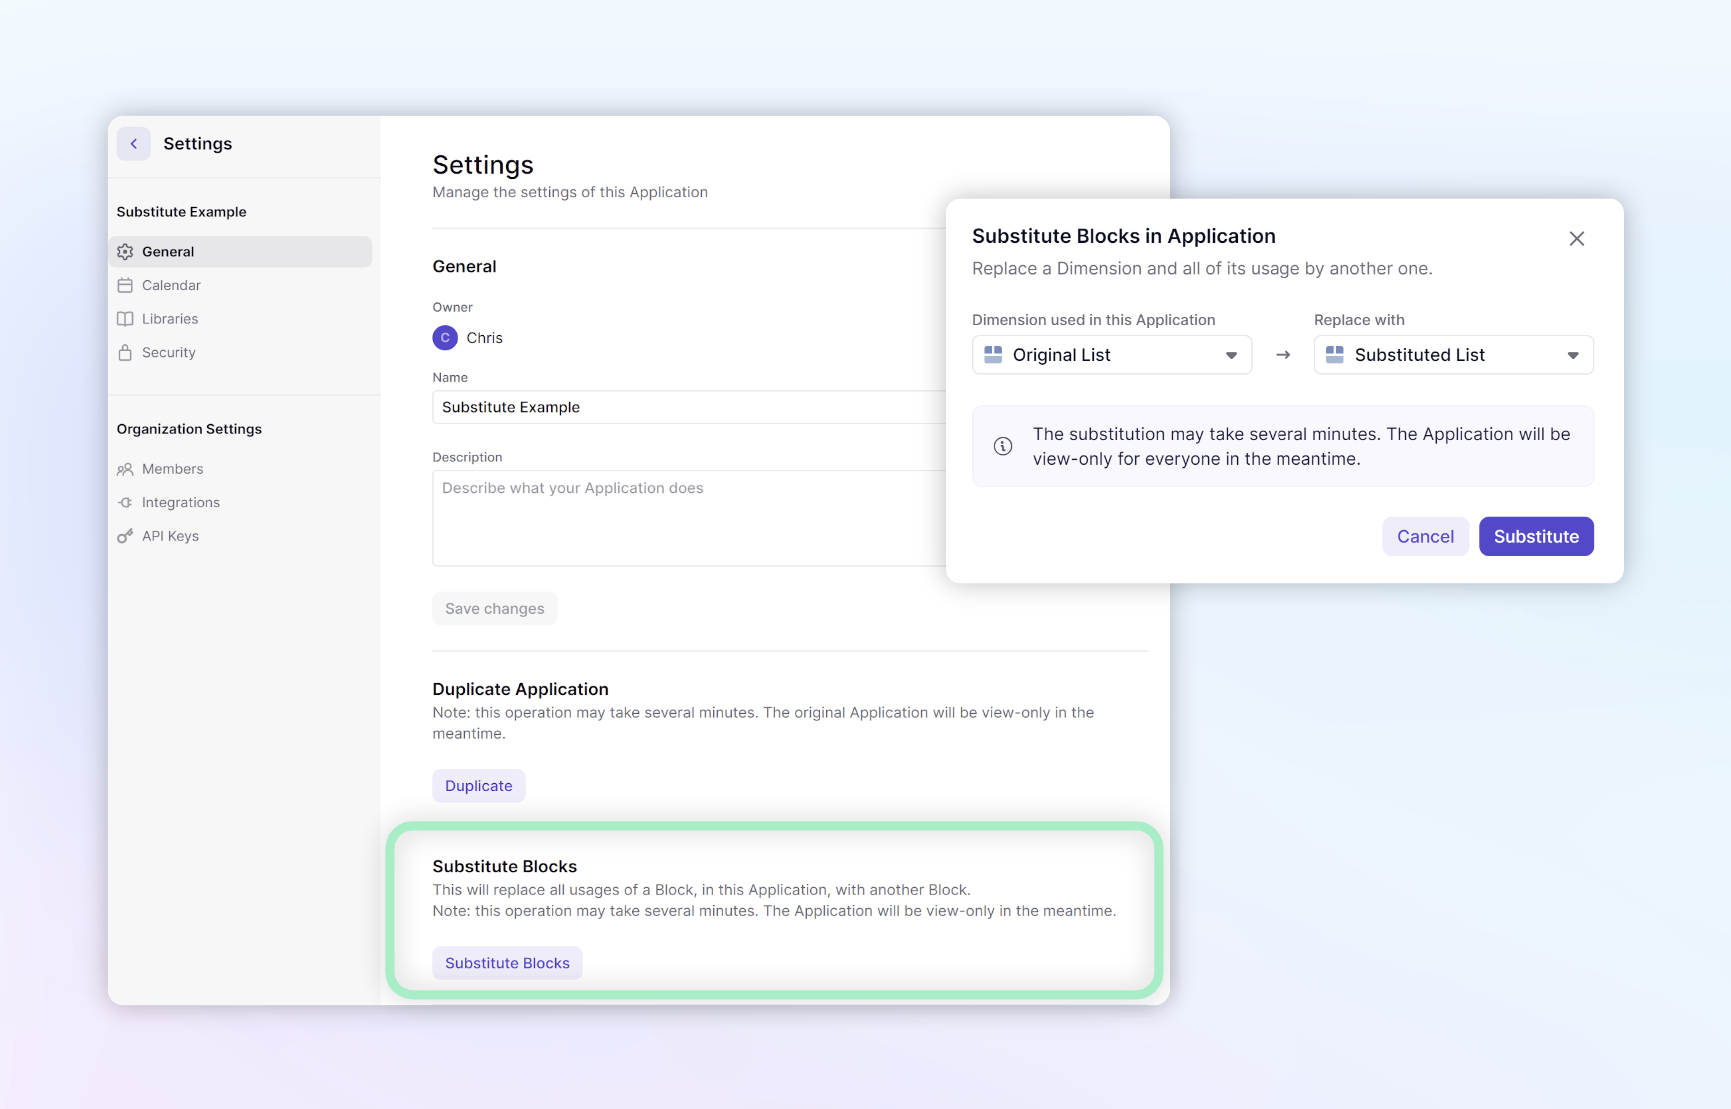
Substitute Blocks
When adding a Data hub or evolving your Pigment Ecosystem, there will be instances where you need to replace a dimension with another one. The subsite blocks feature is able to help you do just that. Here you can one list with another in all instances in an application. While you can easily fix formula errors, you will loose data in metrics without formulas. Coupled with the Move functionality, it makes updating workspaces much easier.
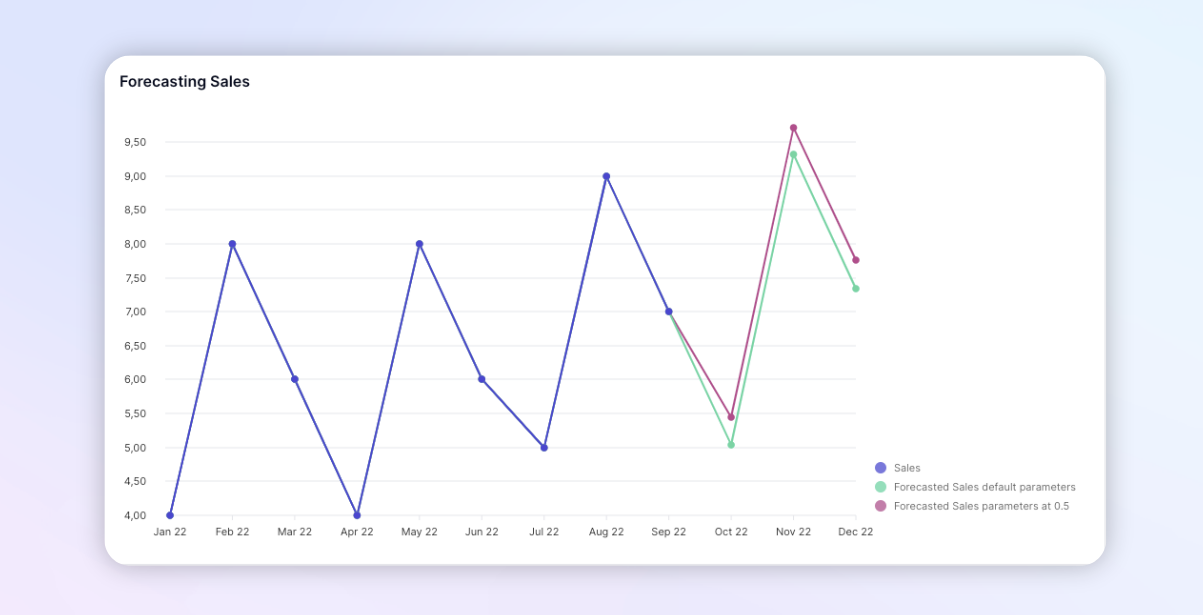
Forecast further
The Forecast_ETS function allows you to forecast time series with seasonality and an additive model. This makes it easy to forecast while still maintaining seasonality.
Fast Integrations
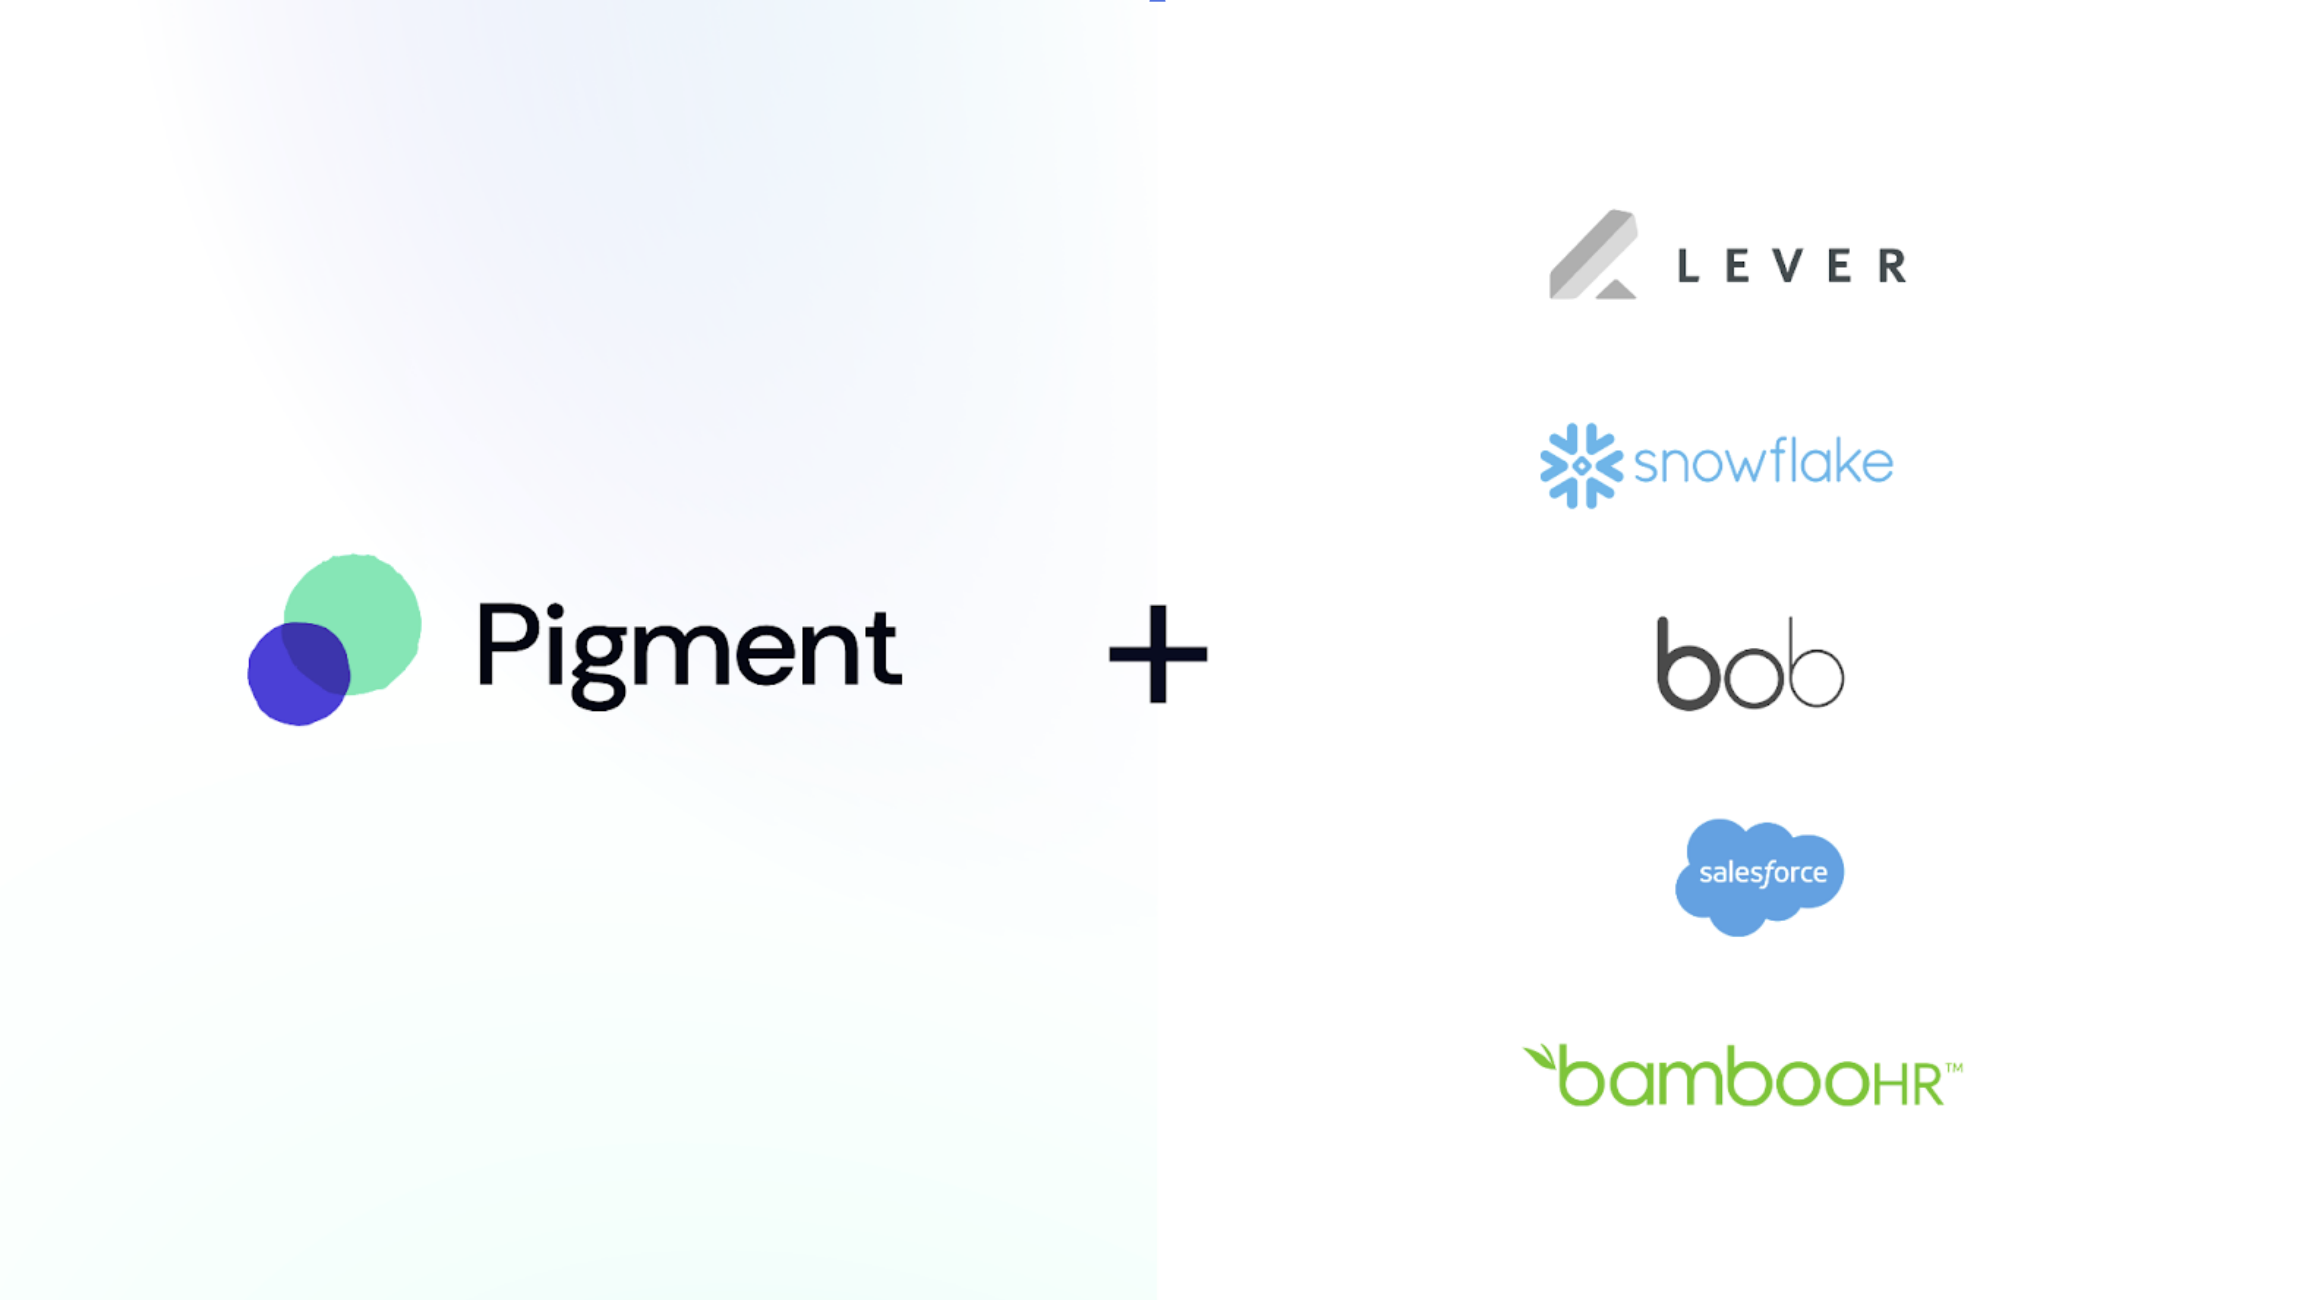
New Data connectors
We introduced quite a few data connectors in the span of a quarter. We added Lever, Snowflake, Hibob, and BambooHR. We also upgraded our Salesforce.com connector to be able to handle SOQL custom queries.
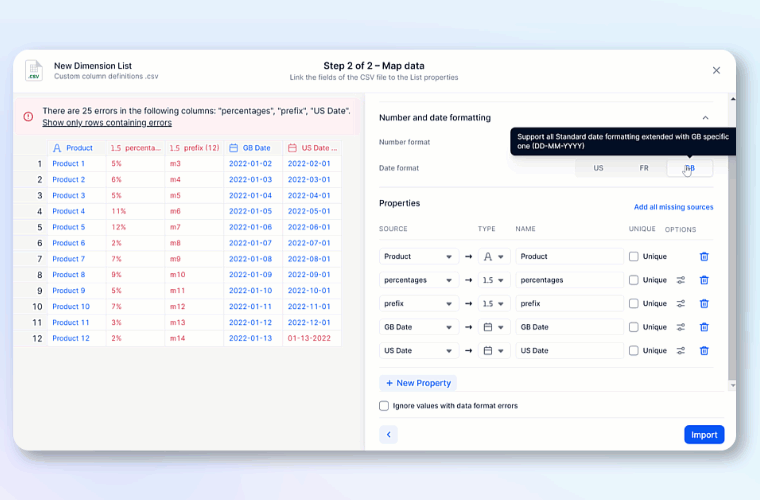
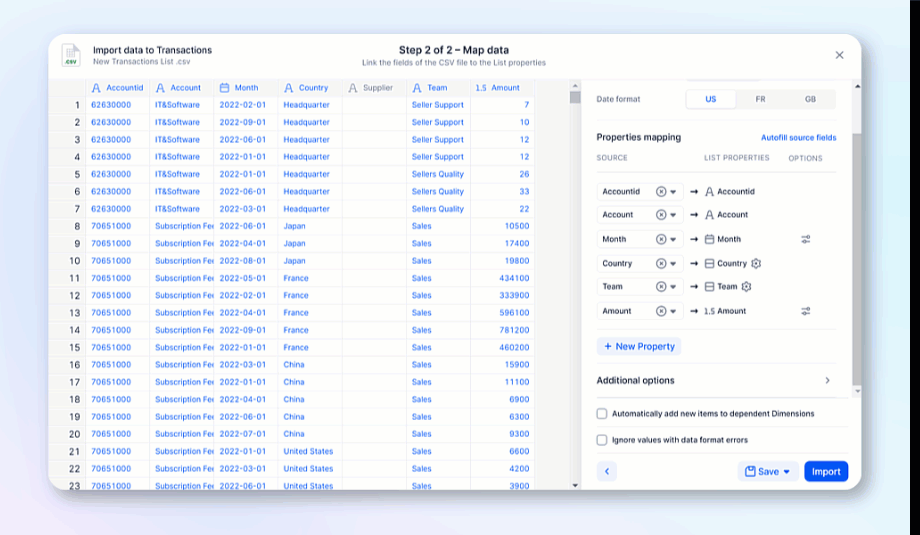
Custom Column data definitions
When importing data, you can now adjust each column individually. You can set different date formats for each column, as well as defined prefix/sufix and any associated multipliers. This takes the work out of adjusting files because you can make the adjustments in Pigment.
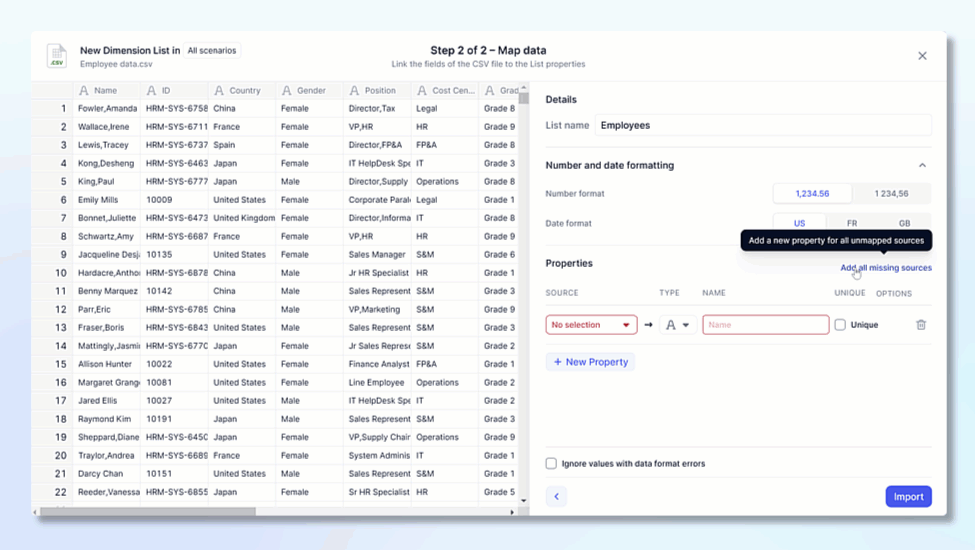
Creating Properties from file
This update came from a suggestion in our ideas section. When importing a file, you can select add missing sources and Pigment will create a property for all unmapped headers. Then all you need to do is align the data type.
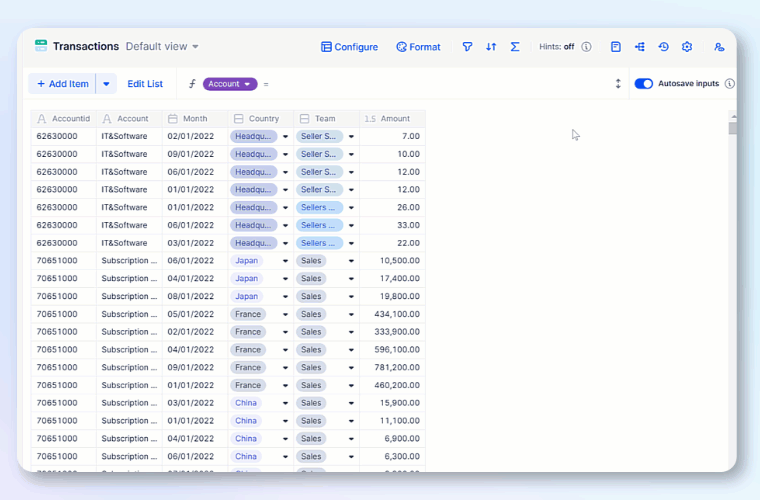
Delete missing items & update saved configuration
When updating transaction lists, you can now select Delete missing list items. This will allow you to make sure that your transaction list matches the source file. We also added the ability for you to update and resave all existing saved configurations.
Trigger data imports
This is a really cool feature that allows you to run data integration connections ad-hoc and update source files with ease. Now, when you go to run an import, all saved configurations are able to be run. For data connectors, you just click a button. With CSV files, you no longer have to remap, just upload your new file.
Check out how to set it up.
Secure Data
Impersonate users
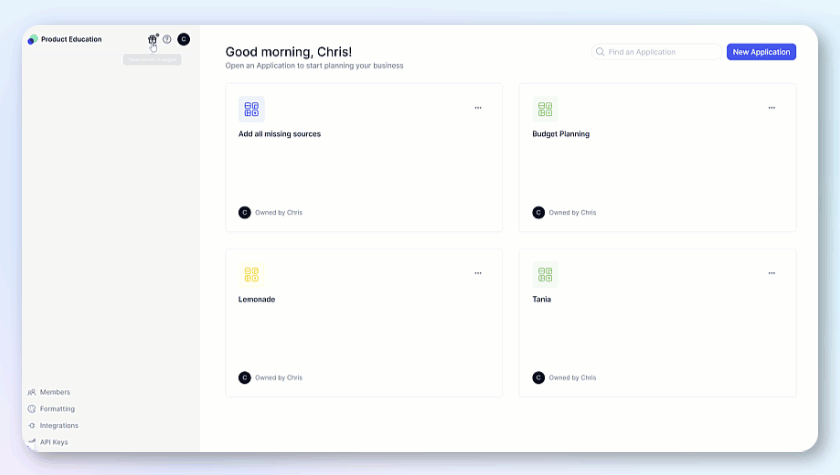
The new Impersonate users functionality is a great way to make sure your users are seeing only the data they should be seeing. Security Admins and Primary owners can now impersonate other users to review their access right configurations.
Thanks for taking the time to read this. Don’t forget you can always check out the latest updates within Pigment by visiting https://changelog.pigment.app/, subscribing to update, or clicking on the gift box at the top of the sidebar. We love to hear your comments when we launch new features!
Thanks,
Chris from Pigment.
