Hi there ![]()
If you reading this article it’s because you have time Dimensions in your model. In practice, time dimensions are present in all models, that’s why we made it very simple for you to create and edit your Calendar settings.
Table of contents
 Where and How
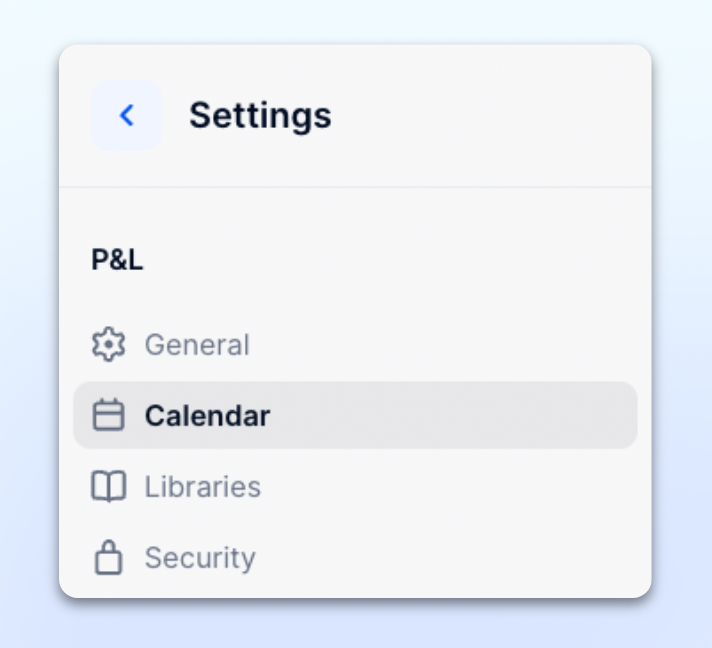
When you create an Application, you’ll need to go to Settings > Calendar to create your time Dimensions. Please note, sometimes our customers like to create a datahub Application, where they add all of their shared Dimensions, including time Dimensions. If that’s the case, you don’t have to re-create them and you’ll be able to use the ones already available in the datahub. If that’s not the case, or you don’t need to use the same Dimensions, let’s keep going.
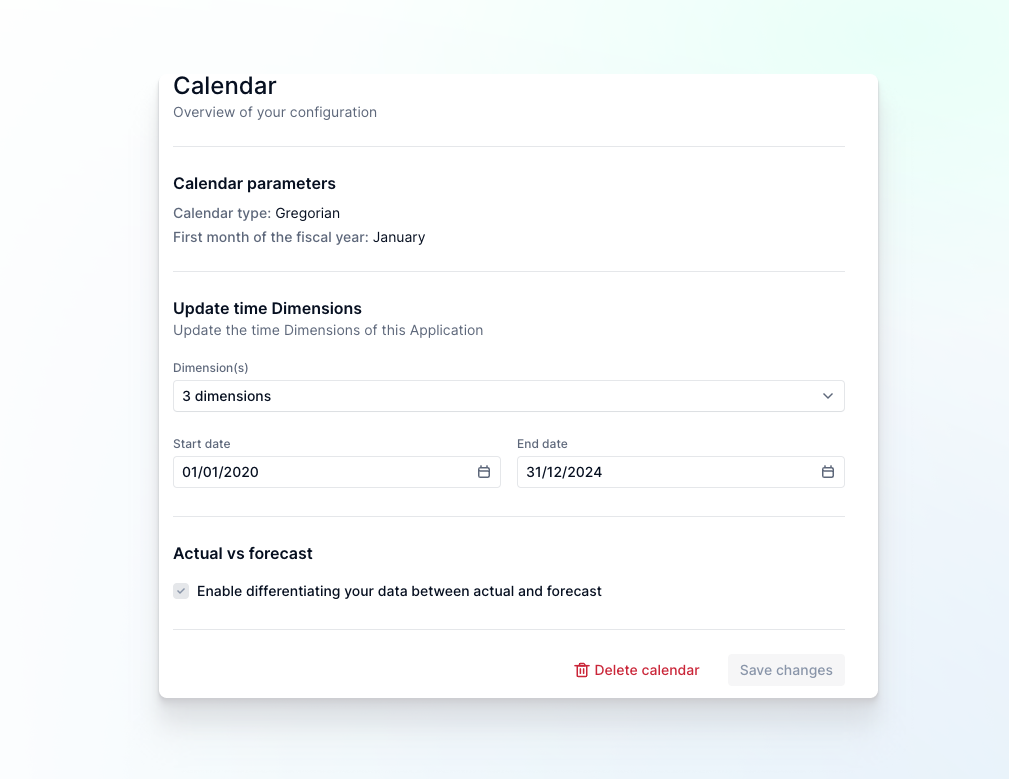
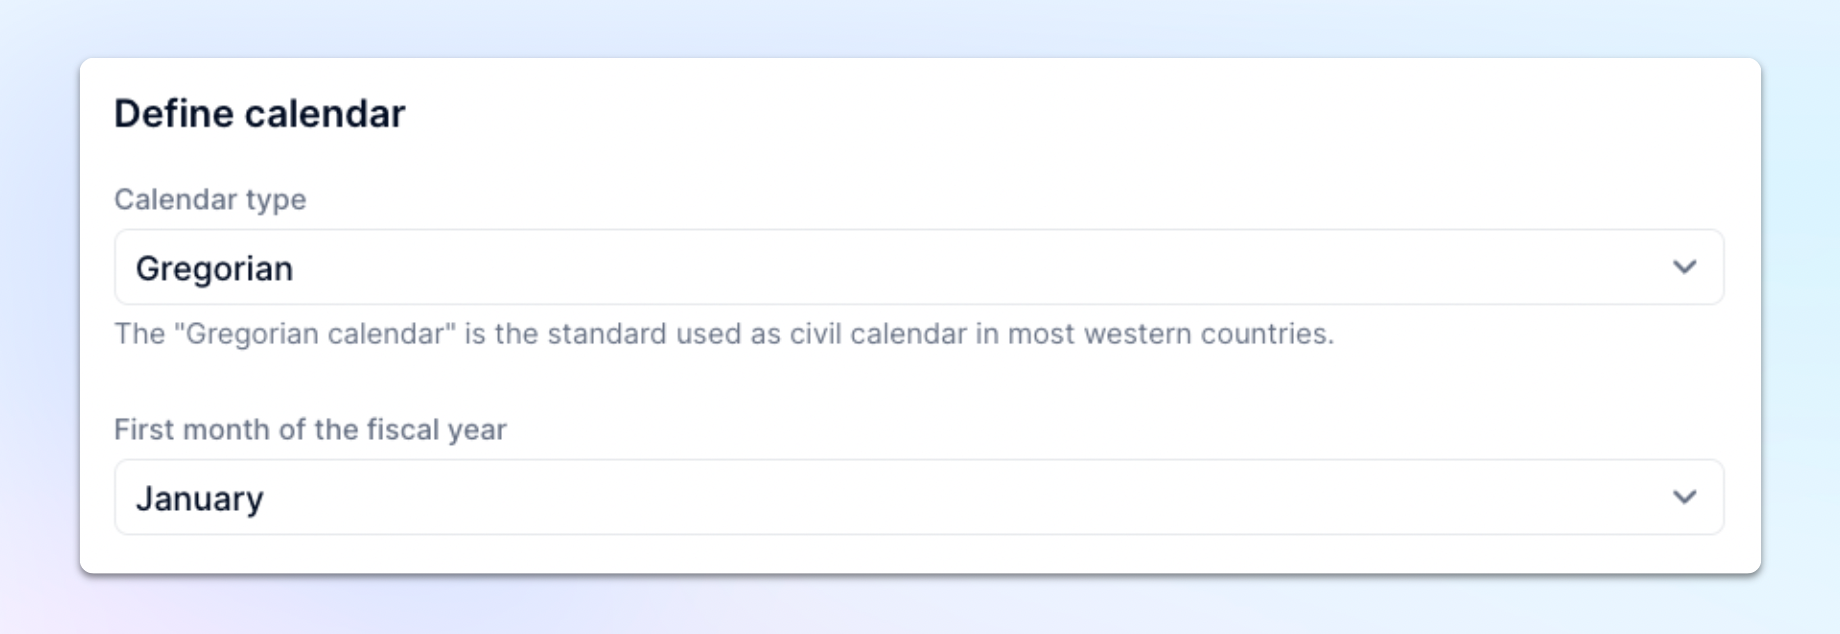
Once you are in the Calendar settings, all you have to do is to fill in the information that you need for your Application. First, define your Calendar, by choosing the type (either Gregorian or weekly) and then select your 1st month of the fiscal year.
Please note: these two settings (‘Calendar Type’ and ‘First Month of Fiscal Year’) can’t be modified once your Dimensions have been created.
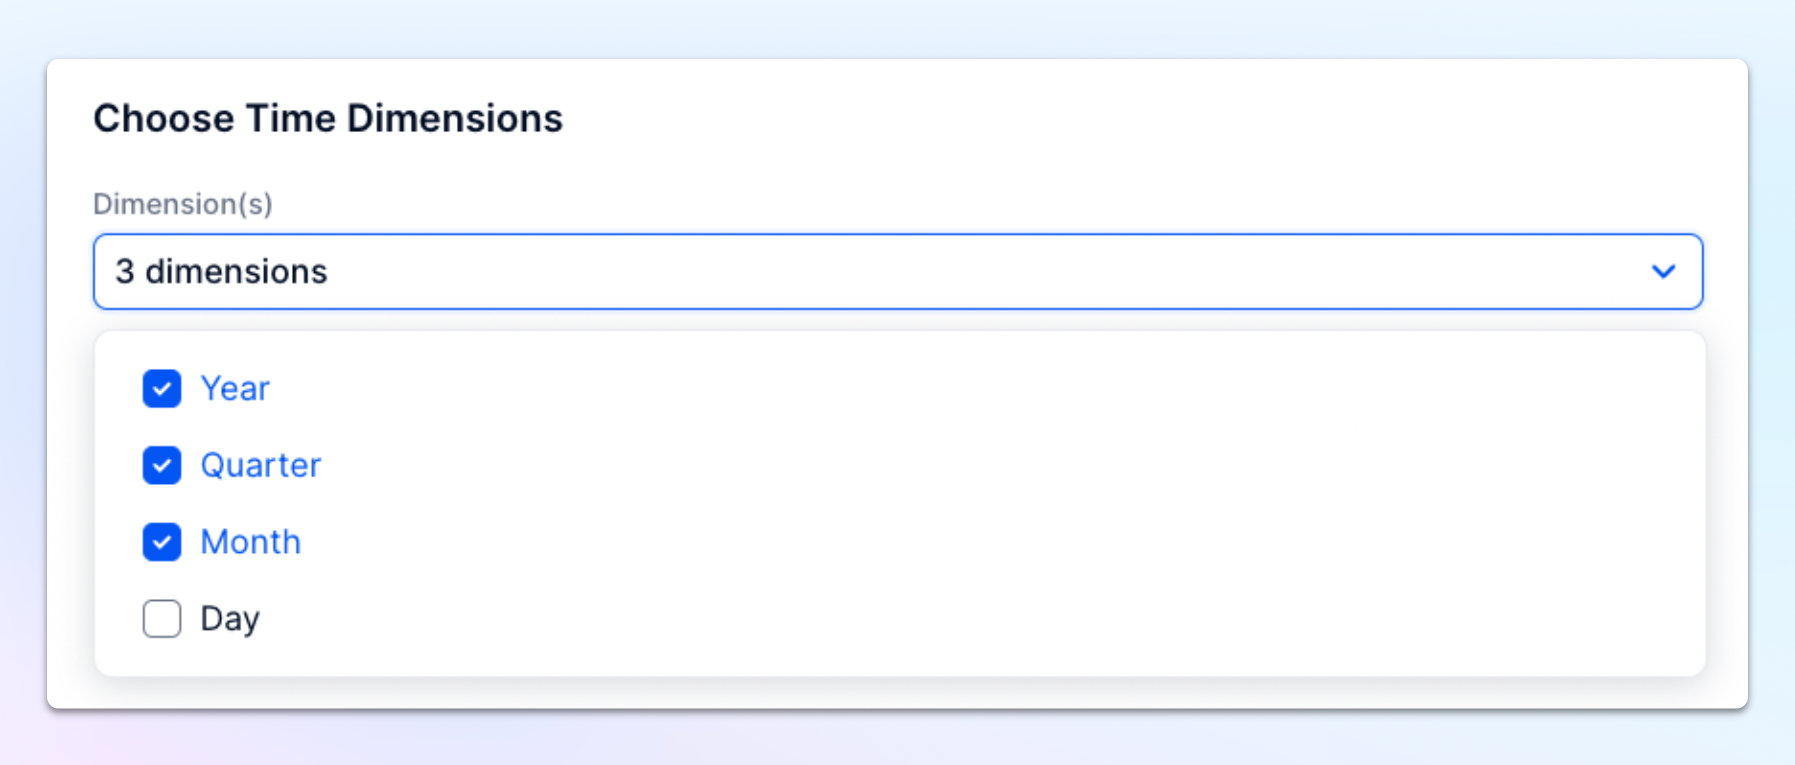
Finally, you can quickly select the Dimensions you’ll need in your time based Metrics. By selecting Month, Quarter and Year, Pigment will automatically create them and save you time by adding them as Properties of each. Here, you can also select when your data is starting and what is the latest date you need.
Please note: you can always come back to amend the Dimensions and Date Range at a later stage.
The last thing to set up is the “Actual vs Forecast”, if you decide to tick this box Pigment will automatically enable you to differentiate your data between what is actual vs what is forecast.
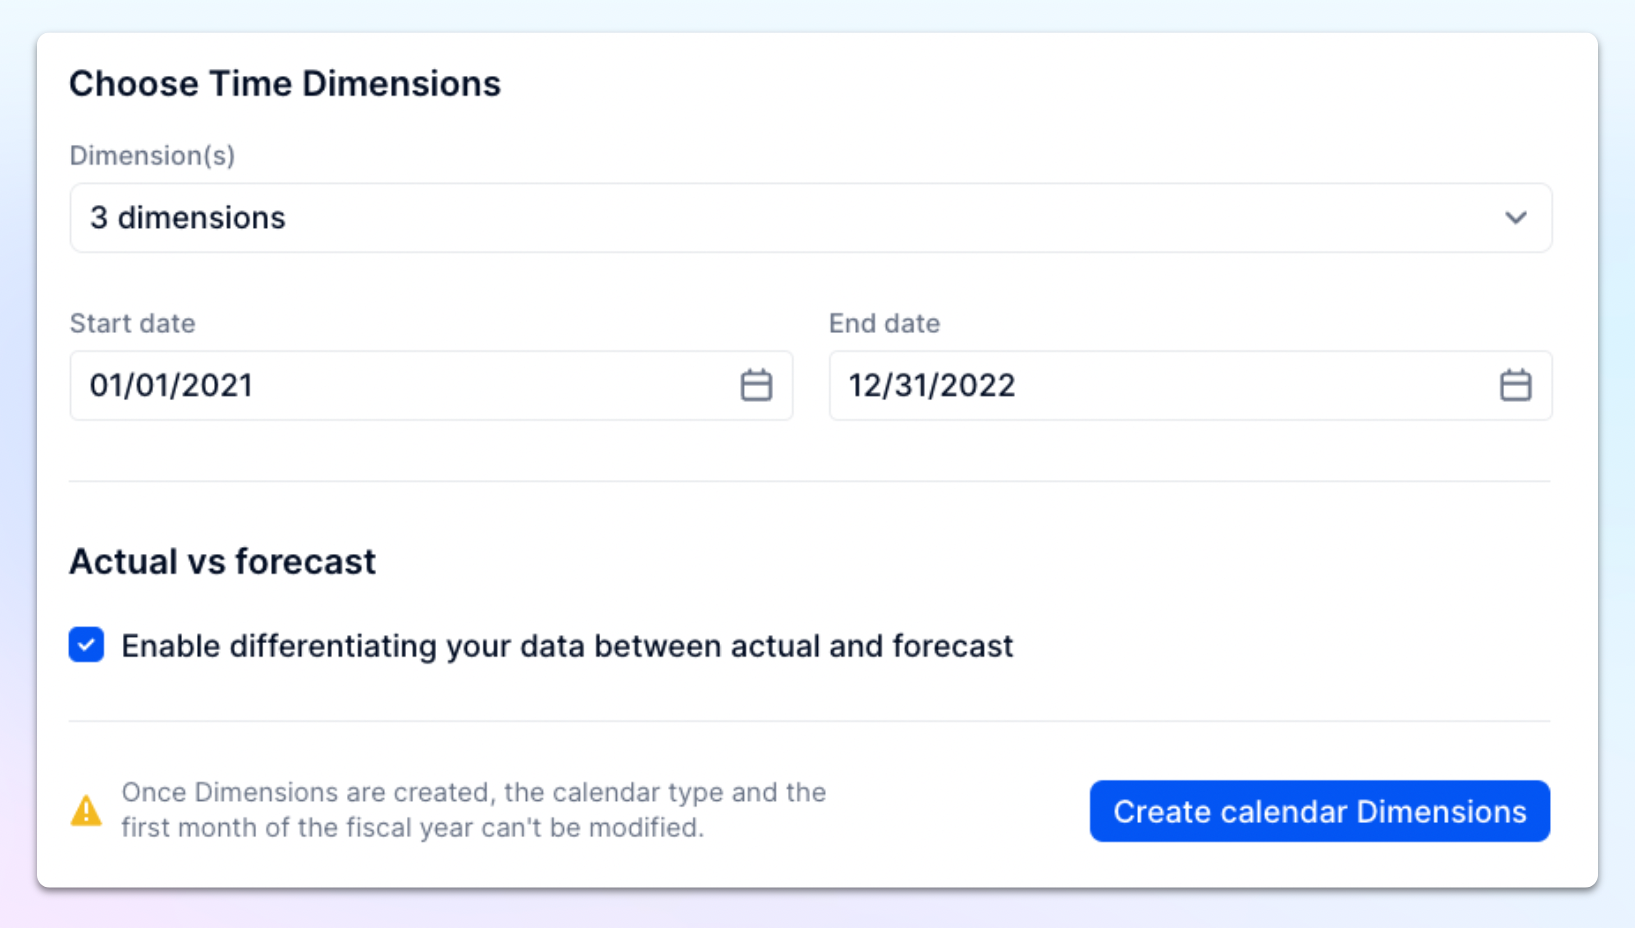
Now, let’s select “Create calendar dimensions” at the bottom of the page.
What is created
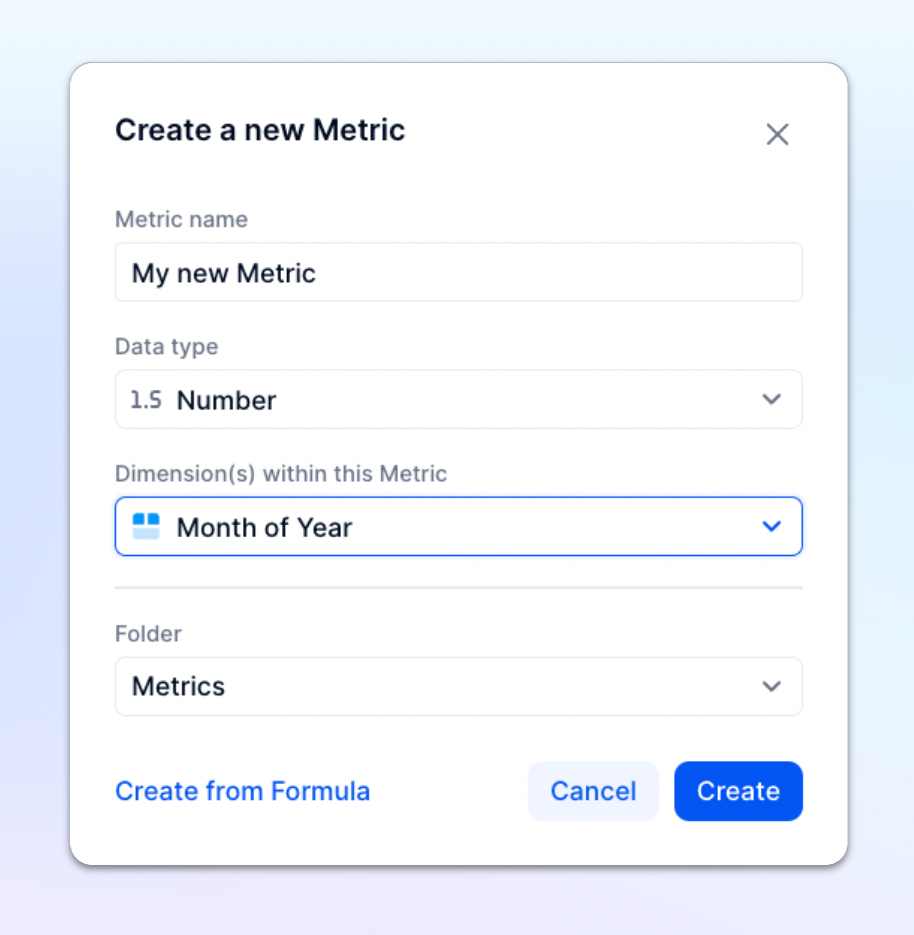
Now that you’ve completed the steps above, you will find in the Blocks section of your App, a folder called “Calendar” and you’ll see that 6 Dimensions and 1 Metric have been created.
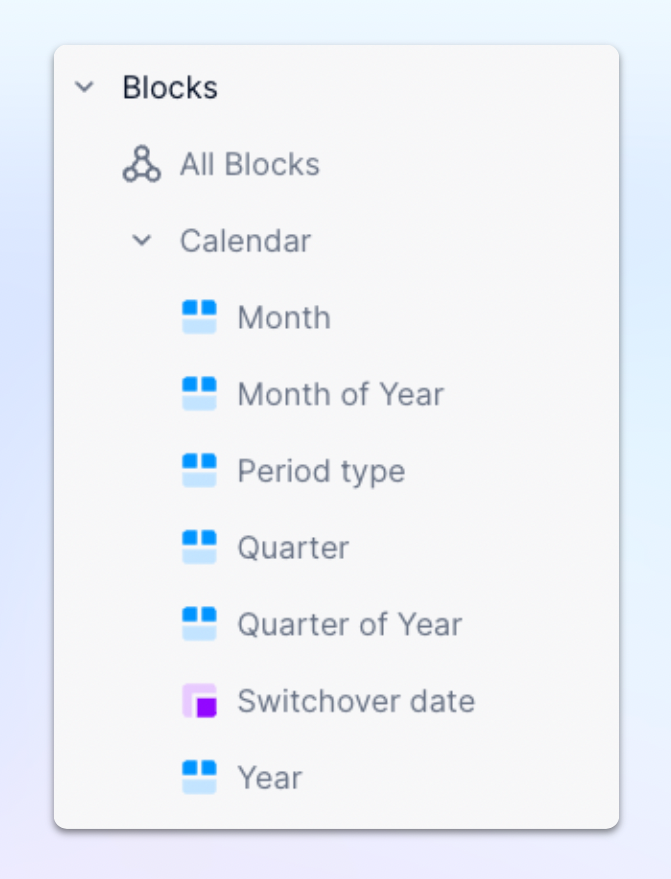
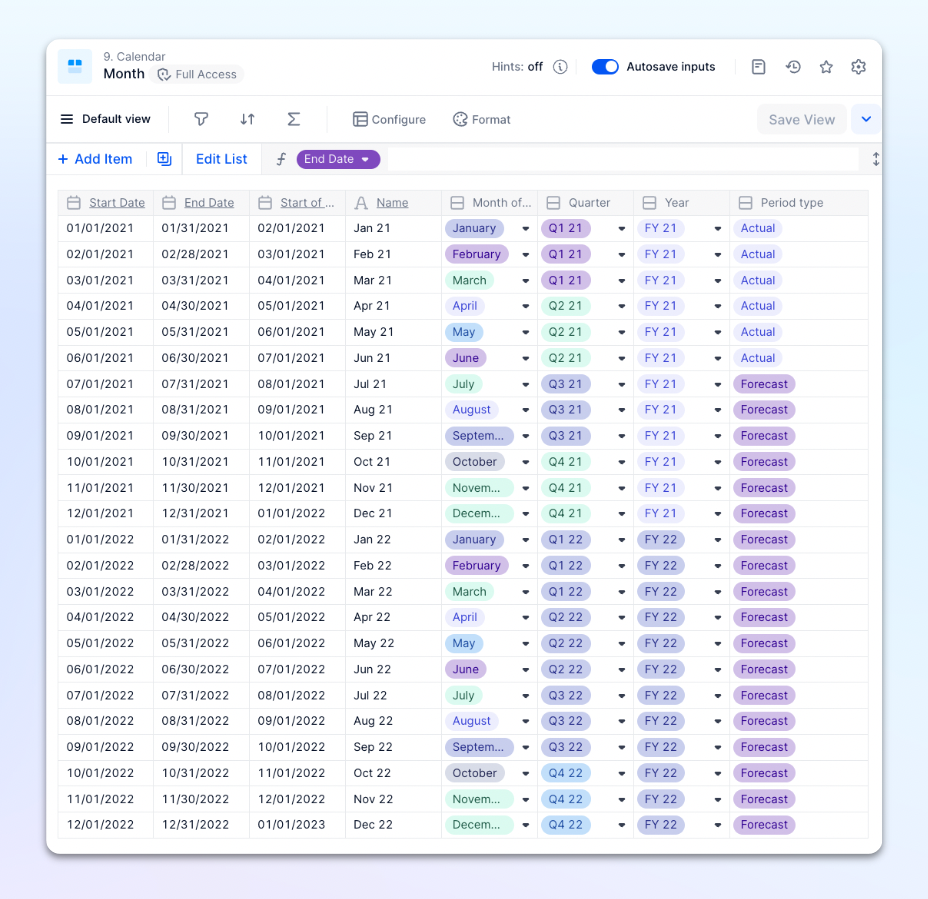
Let’s select the Month dimension.
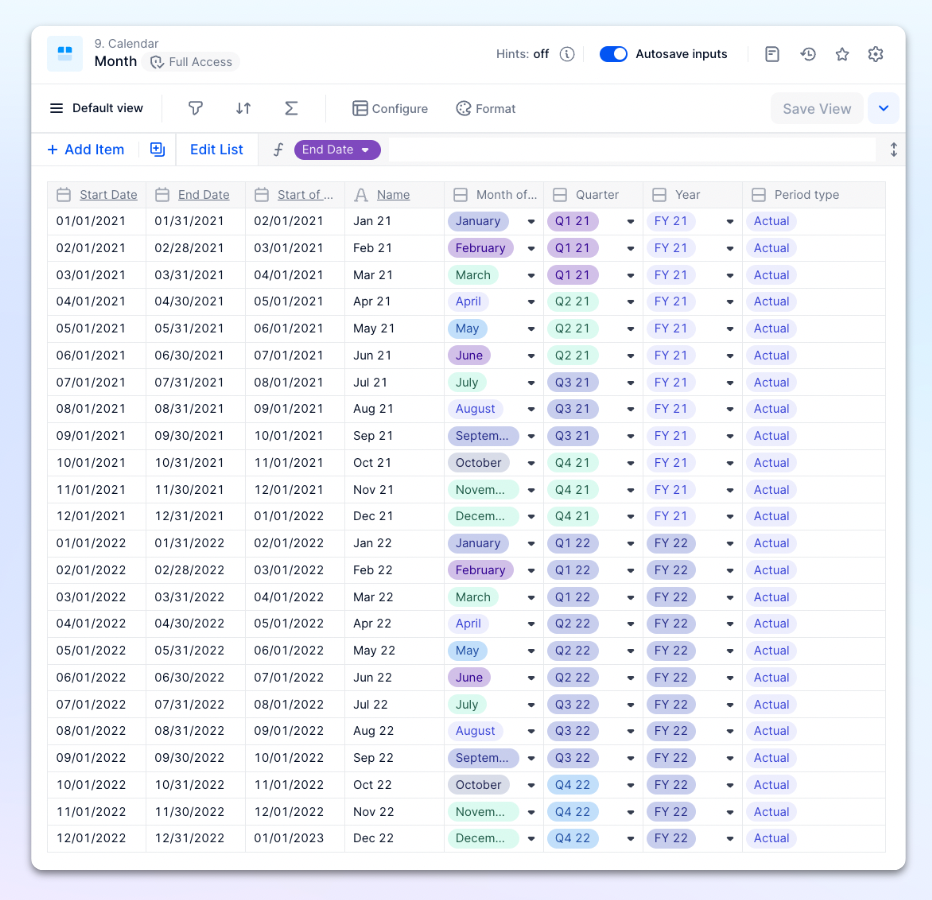
Quite a few Properties have been mapped to the Month Dimension. So if we review each Property we have:
- Name of the month
- Quarter Dimension
- Year Dimension
- Start Date
- End Date
- Dimension Month of the Year
- Dimension Period Type
As you can see, everything is auto-populated, so that, for example, Pigment knows that January is from 01/01 to 31/01 and it is part of the Period Type - Actual.
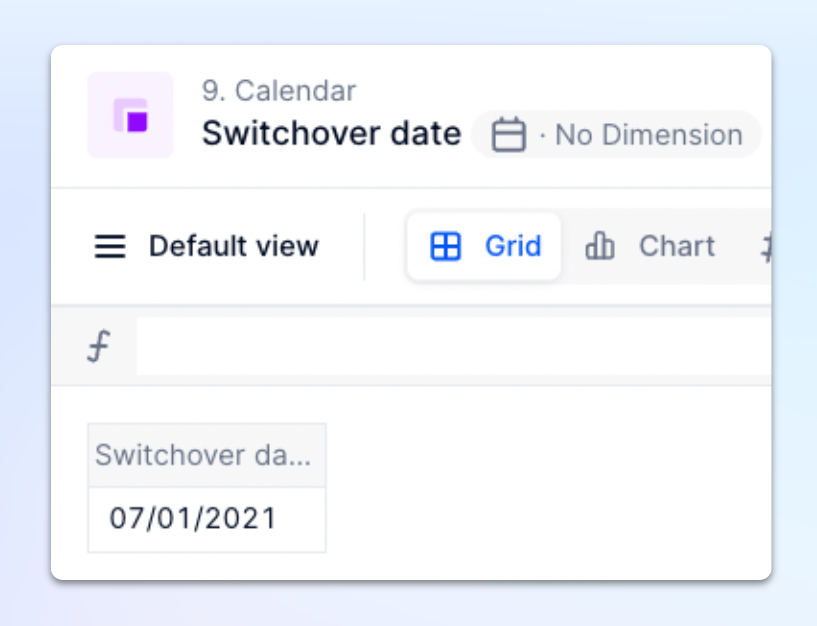
Speaking of Period Type, it’s important to highlight that it creates a Dimension (that includes two items Actual and Forecast and an integer property display order 1 and 2), and also a Switchoverdate Metric (which is our first date of Forecast).
Let’s go to the Switchover Date Metric, change the date to 1 July 2022.
Now, let’s analyze the impact it’s had on the Month Dimension. Here the Period Type Property has been updated with the correct actual vs forecast.
As we set the 1st month of the forecast to July, we can see that from July its moved to Forecast, thanks to a predefined formula:
IF(Month.'End Date' >= 'Switchover date', 'Period type'.Name."Forecast", 'Period type'.Name."Actual")
If the Property End Date of the Month Dimension is superior or equal to the switchover date, then Pigment should display the text “Forecast” of the Dimension Period Type, otherwise display the text “Actual” of the Dimension Period Type.
Bonus: Actual vs Forecast is not always as simple as in this example, so I’d suggest you take a look at our Using Growth Hypotheses to Forecast Revenue article in our community.
How to use it
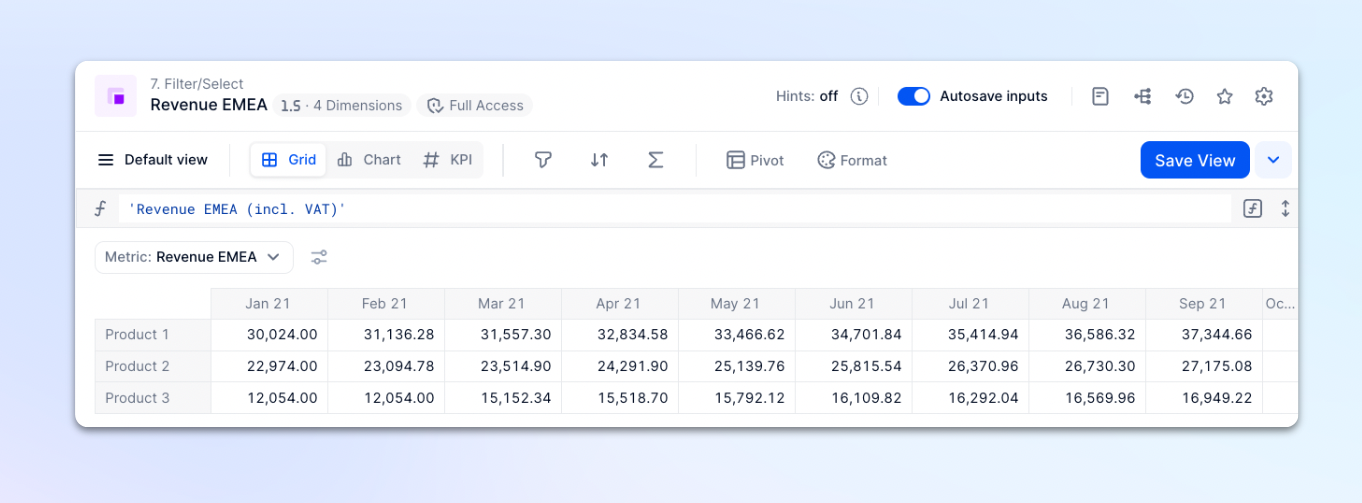
It is now easy for us to create Metrics based on time Dimensions.
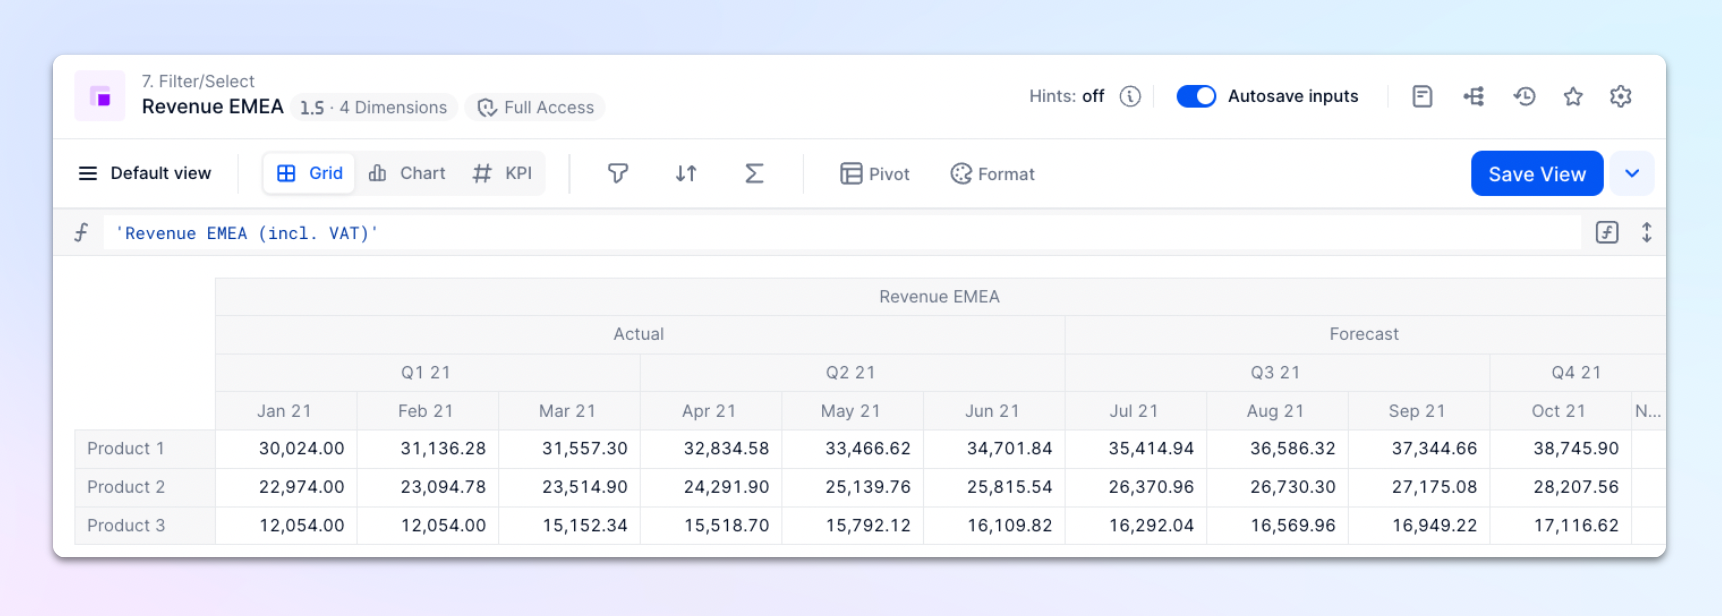
Here, a Metric has been created with two Dimensions: Month and Product.
You can easily add and remove Dimensions to play with the view and aggregations by selecting Pivot. Remember that this is only changes the display options, it is not changing the structure of your Metric. If for example, you need to add the Actual vs Forecast click Month > Period type.
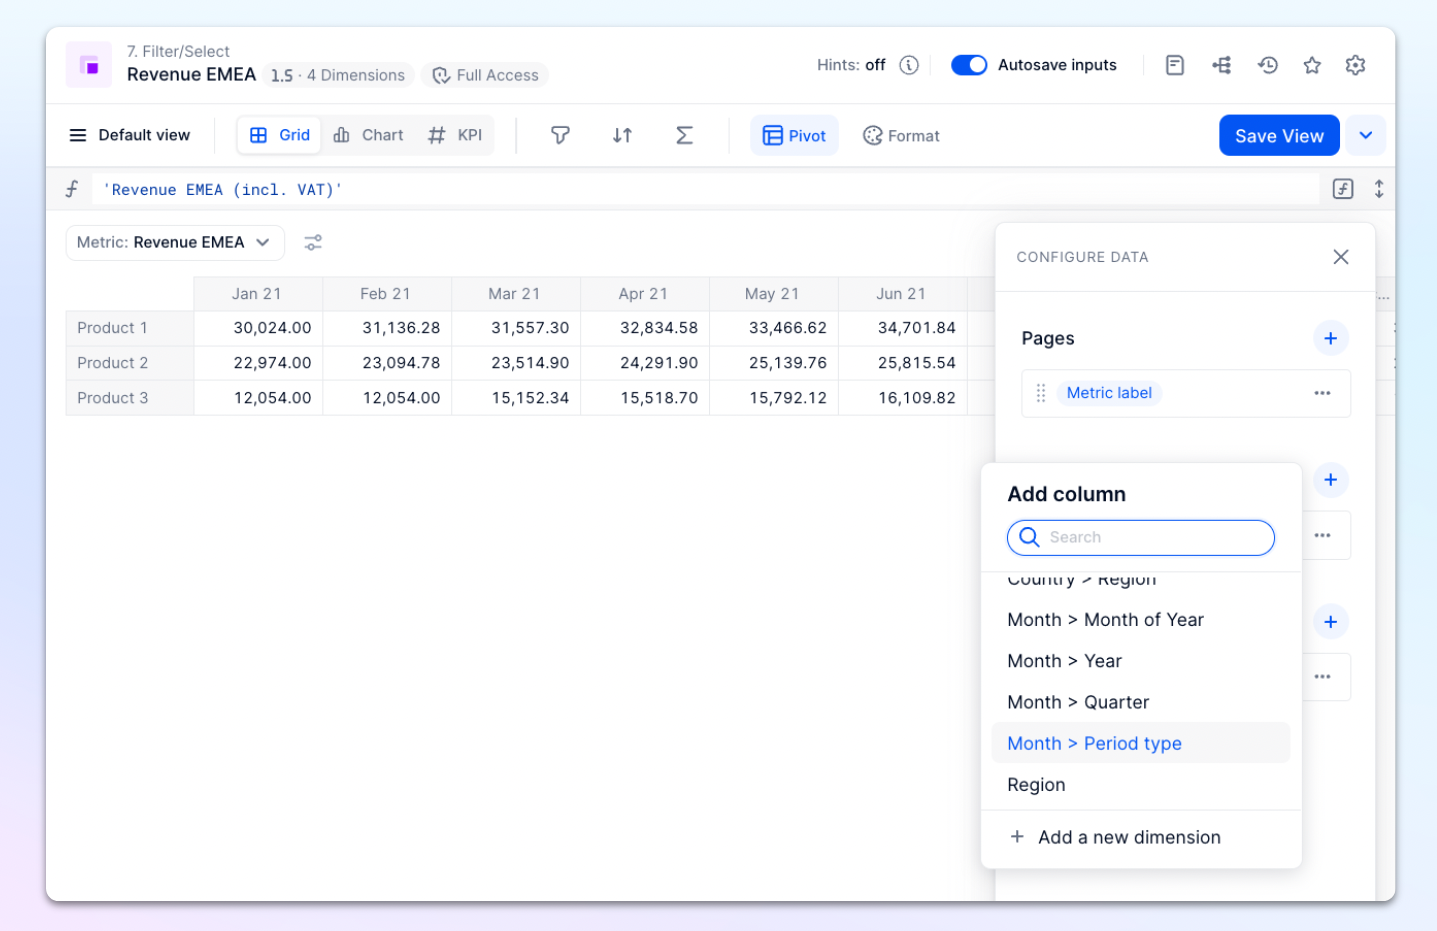
If you repeat this step, and this time select Month > Quarter you’ll see that the quarters have been added to your table according to each month.
Now you have the basis of what you need to start creating your Time Dimensions. However, there is more you can do, such as adding your own personalized Properties with more complex formulas, or even playing with booleans, so stay tuned for more articles on these subjects.
What if I need to delete my calendar?
If you need to delete your calendar, then you can open it in your application settings and delete it! However, you won’t be able to delete a calendar if its Dimensions are used in block structures.