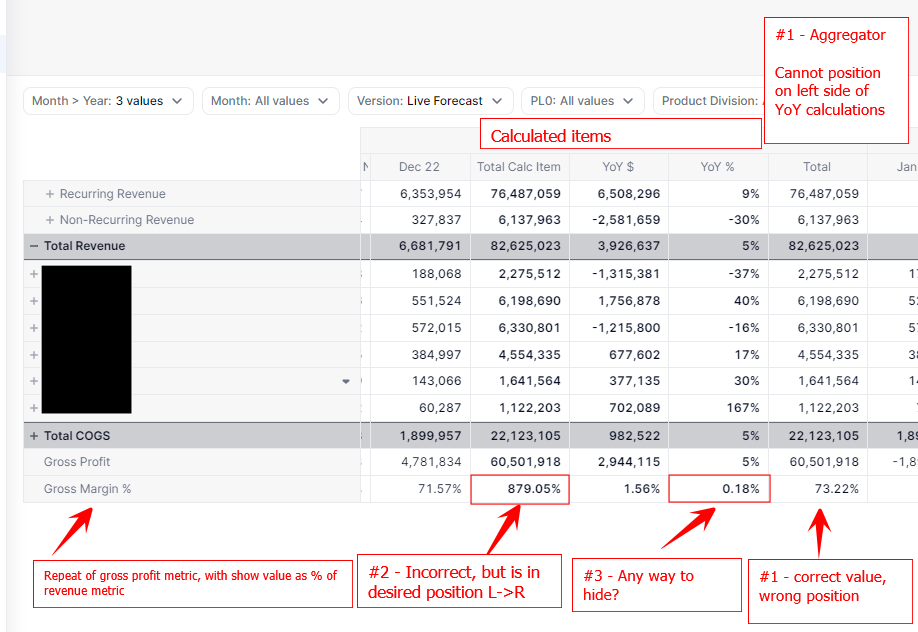
I am trying to create multi year P&L views, with months in the columns. After the last month of the year, I want to show the annual total, YoY $ value, and YoY % change. (Months->Annual Total->YoY $ change->YoY % change).
The challenges I’m encountering are as follows - example with numbered notes shown in snippet below:
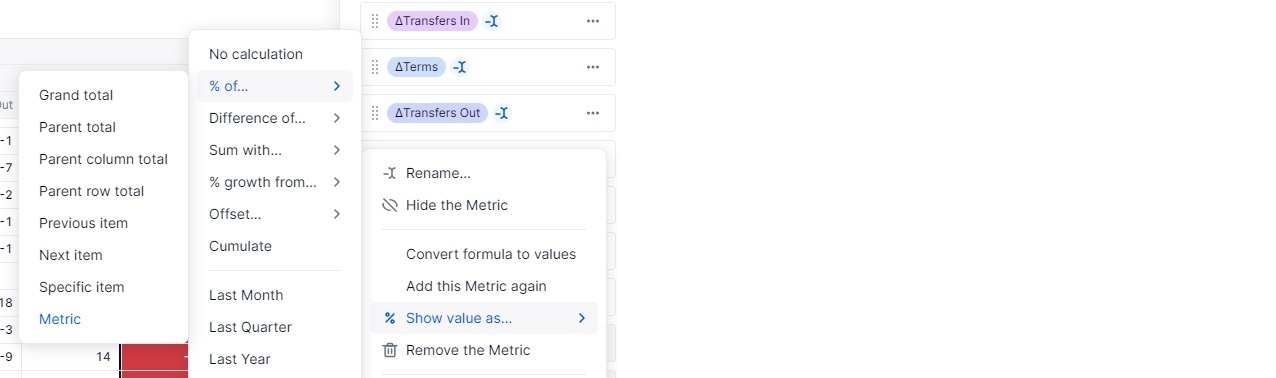
- Inability to choose position of aggregators. Pros of using aggregators vs calculated items are that gross margin % calcs roll up correctly, and the values are retained when I collapse the months and only want to show the annual total.
- Gross margin % calculated items roll up incorrectly. It displays the sum of the months’ percentages, rather than the annual gross profit value divided by the annual revenue value. Pro of calculated item is ability to choose column positioning.
- Is there any way to hide a value in a calculated item? The YoY % calculation displays a nonsensical value when calculating against % margin values. Only workaround I’ve currently identified is formatting the individual cell with white text and background to effectively be blank, but this doesn’t scale well as the formatting doesn’t apply year over year and the value still exists in excel exports..
Are there any workarounds or approaches that I’m not considering here?
Best answer by Stef
View original