Solved

How to create a report on trailing 12 months?

  • 14 July 2023
  • 2 replies
  • 342 views

Userlevel 2
Badge +5

Here’s our table for quarterly metrics.


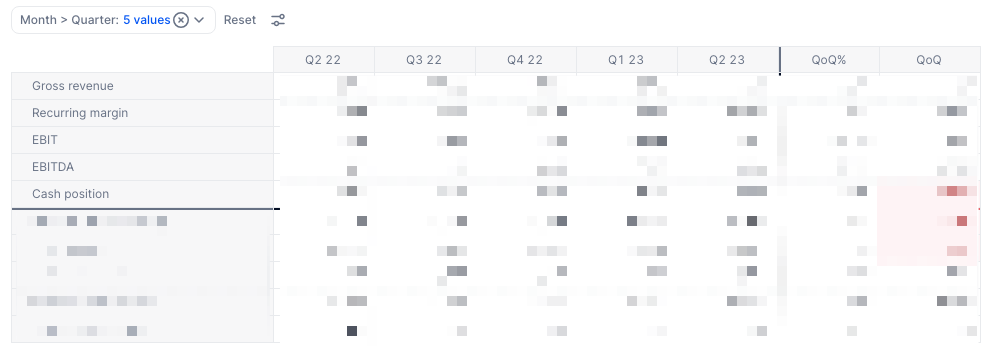
Once we close another quarter, we need to change the pages and adjust QoQ calculated items (even though they may be based on variables).


What is the best way to select pages dynamically? For example, trailing 5 quarters?

icon

Best answer by Khalid Awale 24 July 2023, 05:19

View original

2 replies

Userlevel 2
Badge

Hello Dmitrii,


You can create reports on trailing periods with dynamic pages utilizing dimension lists, metrics, and switchover dates as follows:


1. Configure "Switchover date" and "Switchover month" calendar metrics.

A ‘Switchover Date’ is a predefined Pigment Metric that determines the point (or date) when months are no longer actuals, but forecasted instead. It represents the most recent date at which the data is updated and can be updated manually or with formulas if desired.

?name=image.png

?name=image.png


2. Create a dimension list with your desired dynamic page types.

For example, you can have ‘YTD’, ‘QTD’, ‘MTD’, ‘Rolling 5 QTRs’, etc.

?name=image.png


3. Craft dynamic page metrics using the dimension list.

For instance, to create the Rolling 5 QTRs metric, use the following formula:

TRUE [BY: Month] [FILTER: Month.Quarter.'Start Date' > (TIMEDIM('Switchover date', Month).Quarter - 5).'Start Date' AND Month.'Start Date' <= TIMEDIM('Switchover date', Month).Quarter.'Start Date']


?name=image.png


This metric automatically rolls over a 5-quarter period defined by the switchover date.


4. Create other dynamic period metrics, for example:

MTD metric:

TRUE [BY: TIMEDIM('Switchover date', Month)]

?name=image.png


YTD metric:

TRUE [BY: Month][FILTER: Month.Quarter.Year = TIMEDIM('Switchover date', Month).Quarter.Year][FILTER: Month.'Start Date' < 'Switchover date']

?name=image.png


5. Compile all dynamic period defining metrics into one main ‘Period-to-Date’ metric:

?name=image.png


With this setup, you can easily utilize modifiers such as 'FILTER' and 'BY CONSTANT' to reduce the scope of your source data in other metrics.

For example, the below metric displays Actual data in various dynamic period types defined in the ‘.PTD Flags’ metric we created:

?name=image.png


With this, you should easily be able to calculate the trailing 12 months (TTM) by taking the most recent YTD, plus the last complete year, subtracted by the previous year’s YTD period

If you need any further assistance, don't hesitate to reach out!


Best regards,

Khalid Awale

Userlevel 2
Badge +5

Is there a way to use “Filter” in a view? For example, have a property in `Quarter` that shows relative period number, where `0` is current. Then use that as filter?

Reply