


I would like to be able to show Aggregate (aka SUM or AVERAGE) values in charts on Tables or Metrics. When creating an aggregate field in Pigment on the Grid View, you can see Totals or when using Show Value As you can see items like Revenue per customer (Revenue and # of Customers are two separate metrics). However, when moving to Chart View the aggregate values are not visible in the Chart View

 +2
+2
- Newly Minted Pigmenteer
- 6 replies
-
16 February 2023

Hello, is there any answer for this question ? Thanks

Userlevel 2
 +1
+1
- Newly Minted Pigmenteer
- 4 replies
-
16 February 2023
Hi!
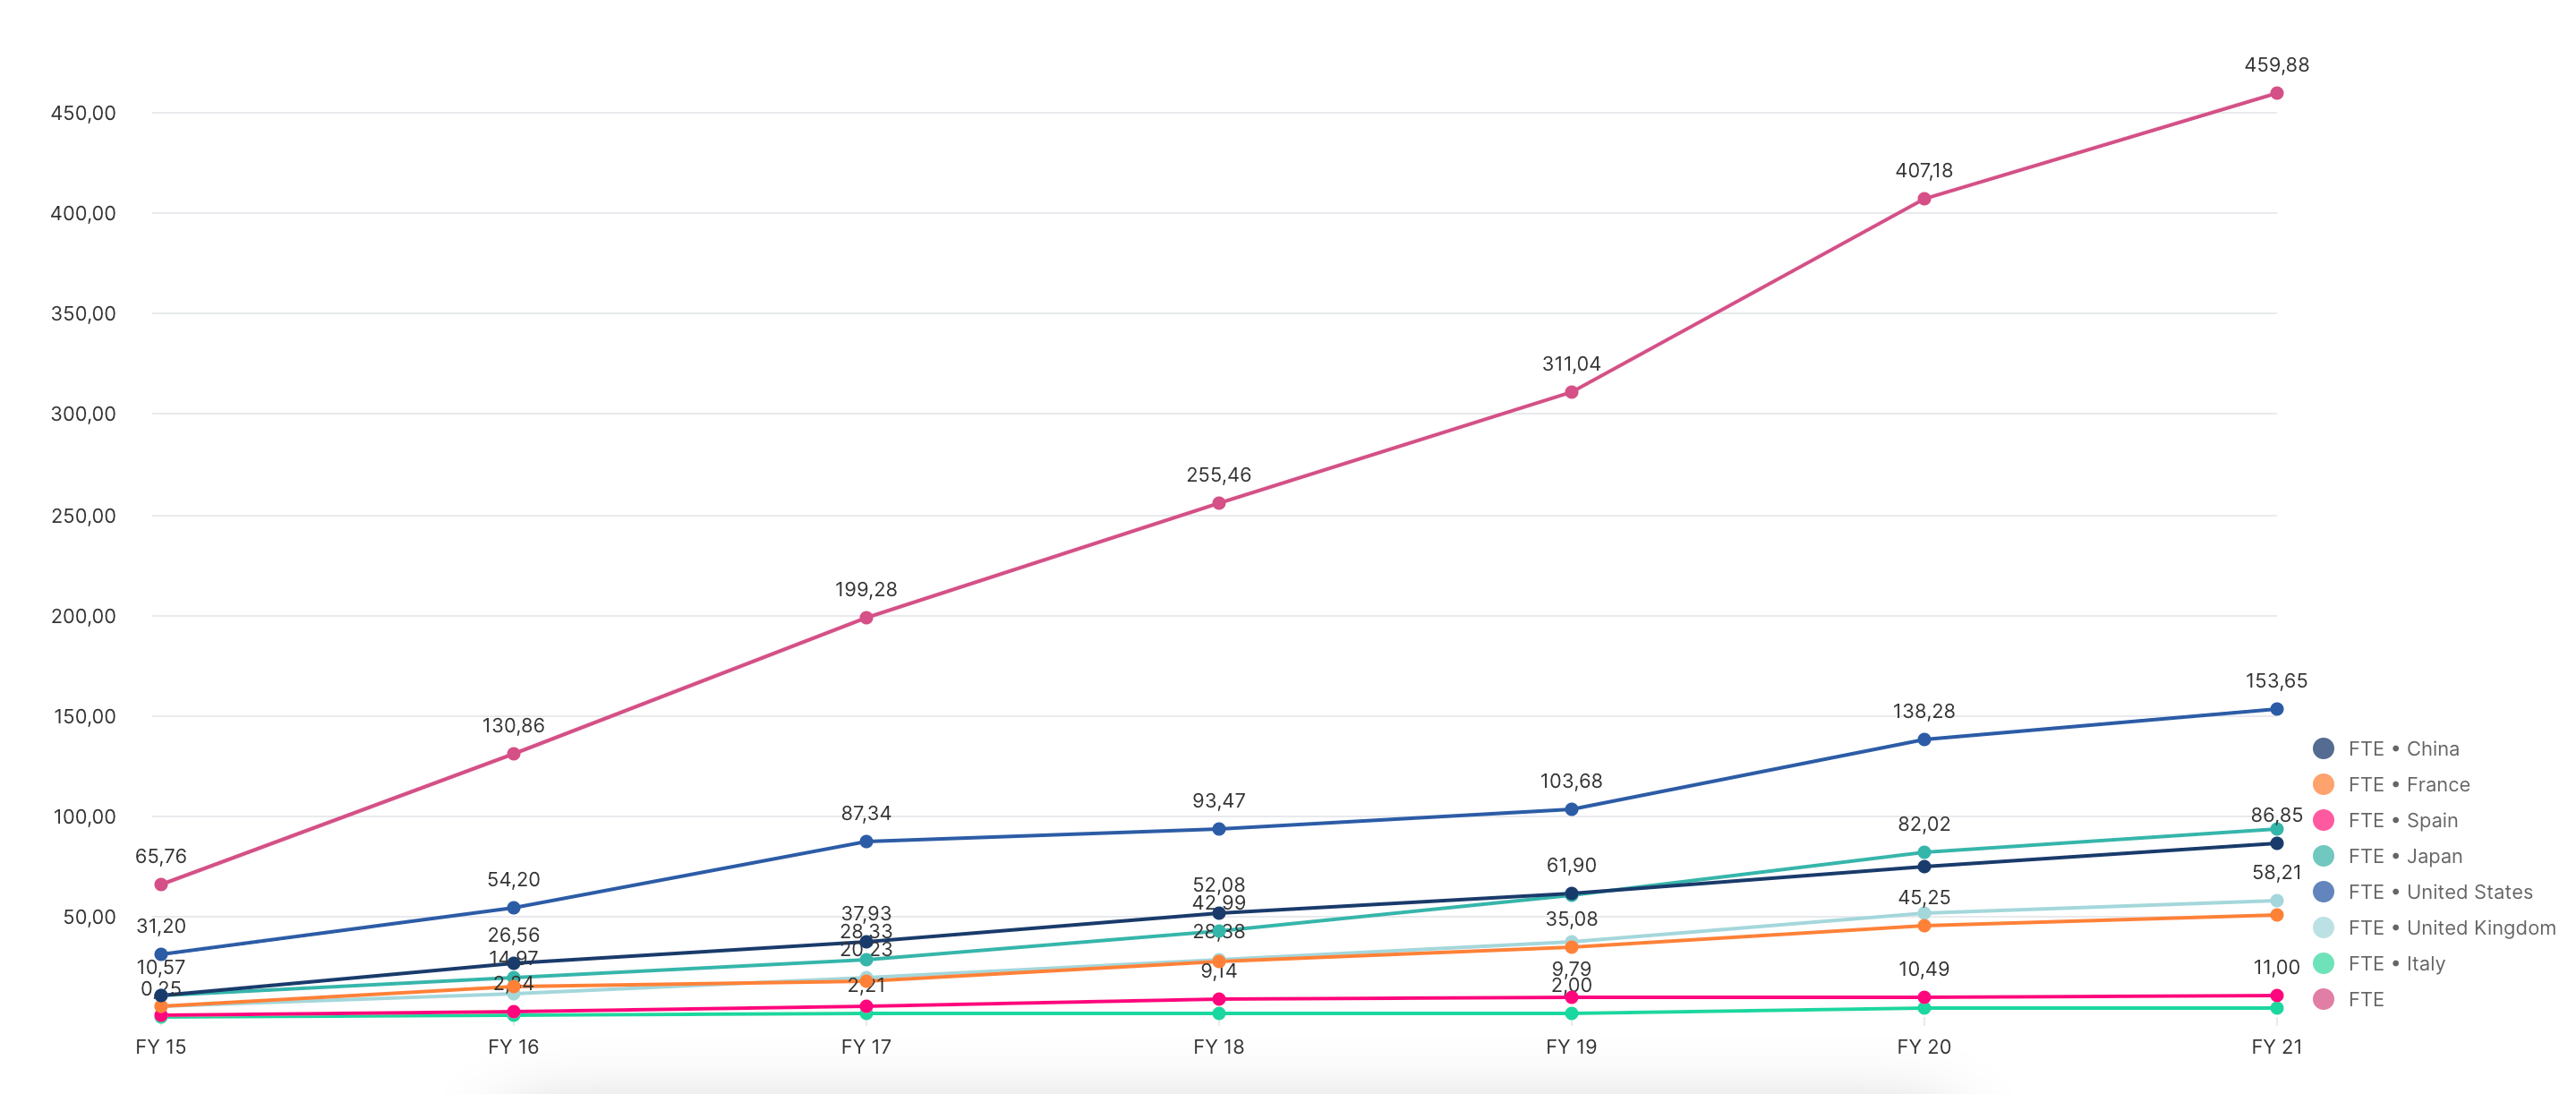
Yes indeed the Aggregate methods does not appear in the Chart View except for Bar chart view stacked where you can check the “show stacks totals”.
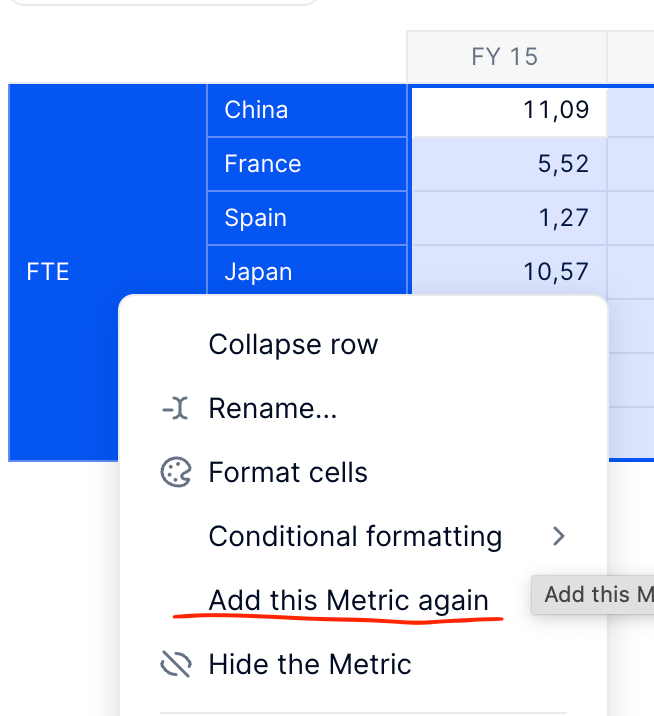
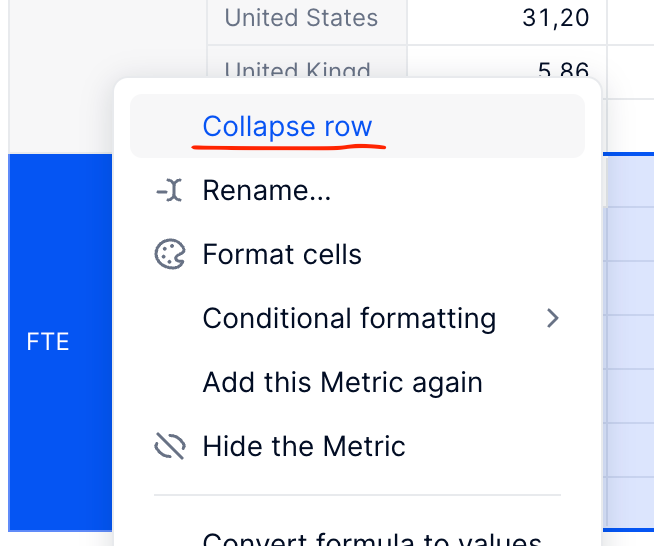
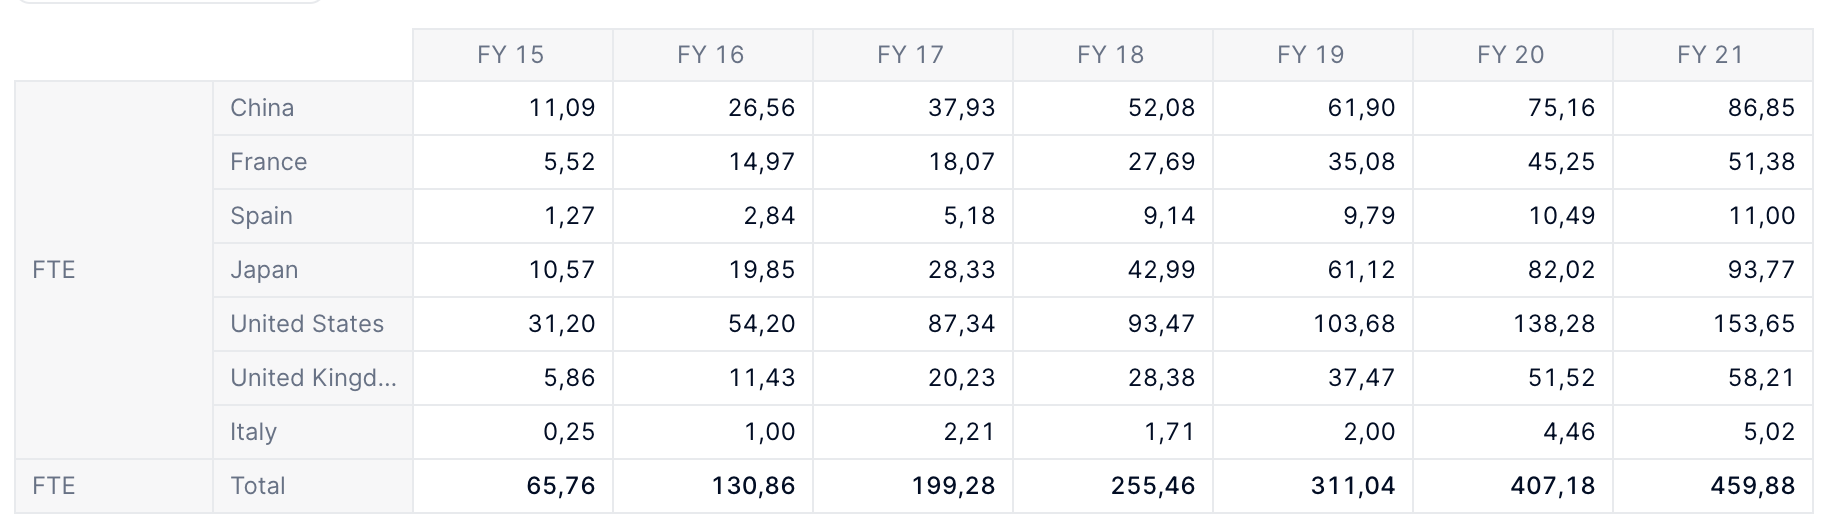
However you can set a Table with your metric and the dimension you want to aggregate in row, click on “Add this metric again” then “Collapse row” on the dupplicated metric to see the total.
I hope this answer helps you 🙂
Olivier
Reply
Enter your username or e-mail address. We'll send you an e-mail with instructions to reset your password.