Solved

View Actuals + Forecast one table

  • 17 February 2023
  • 6 replies
  • 243 views

Userlevel 3
Badge +5

Hi Pigment Community! 


I wasn’t able to find a prior thread on this:


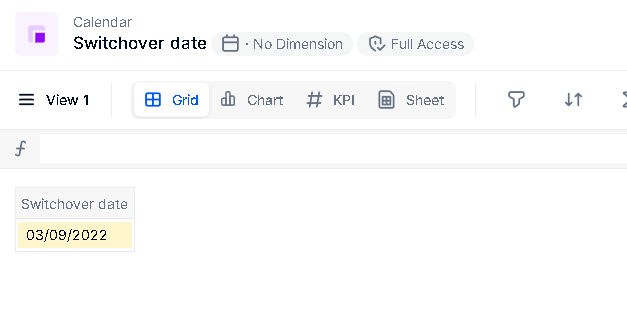
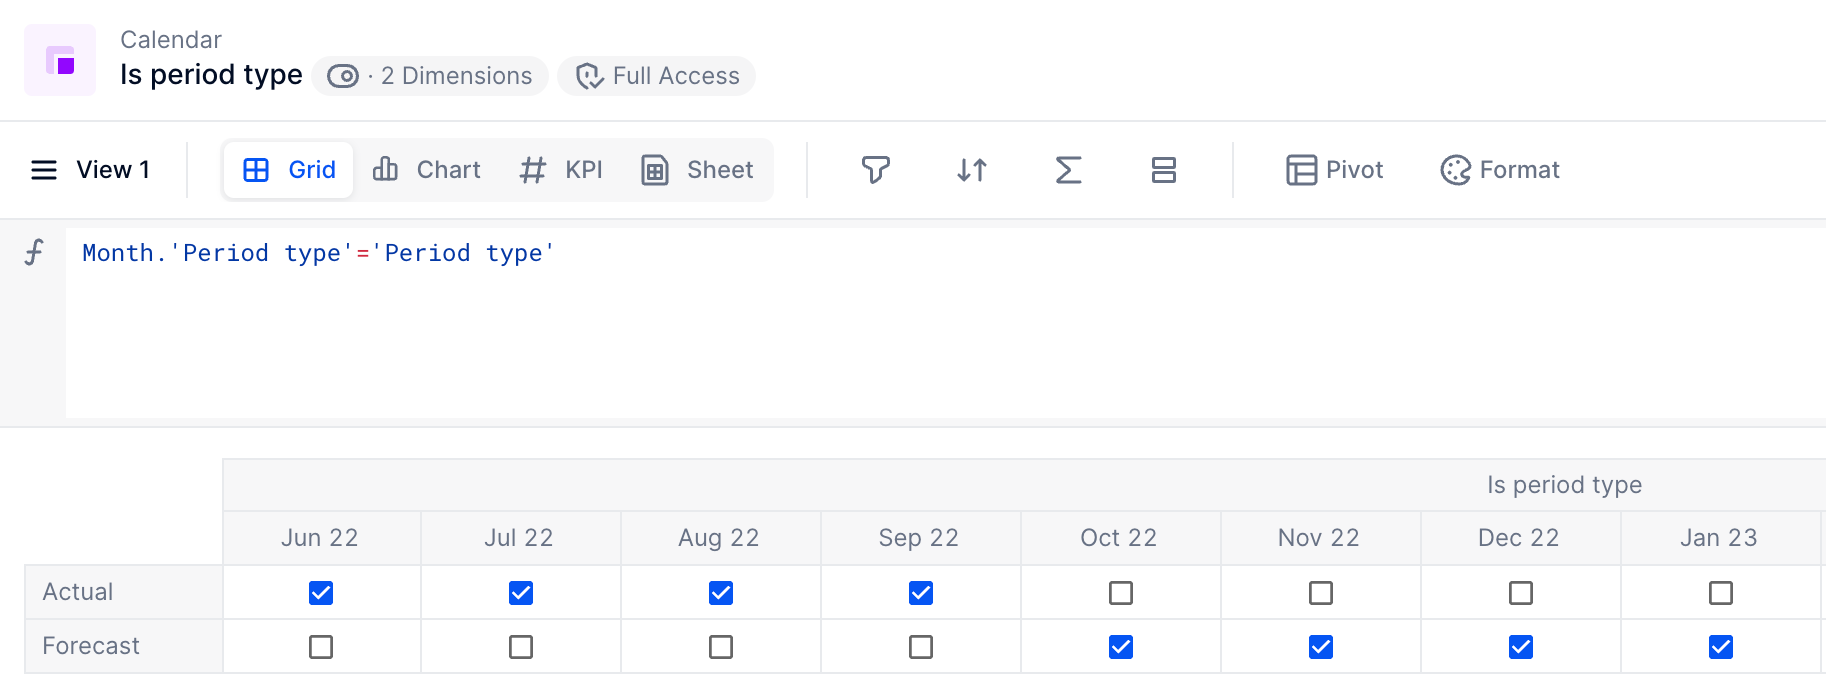
What’s the best practice to show Months of Actuals and Forecast together based on the Switchover Date?


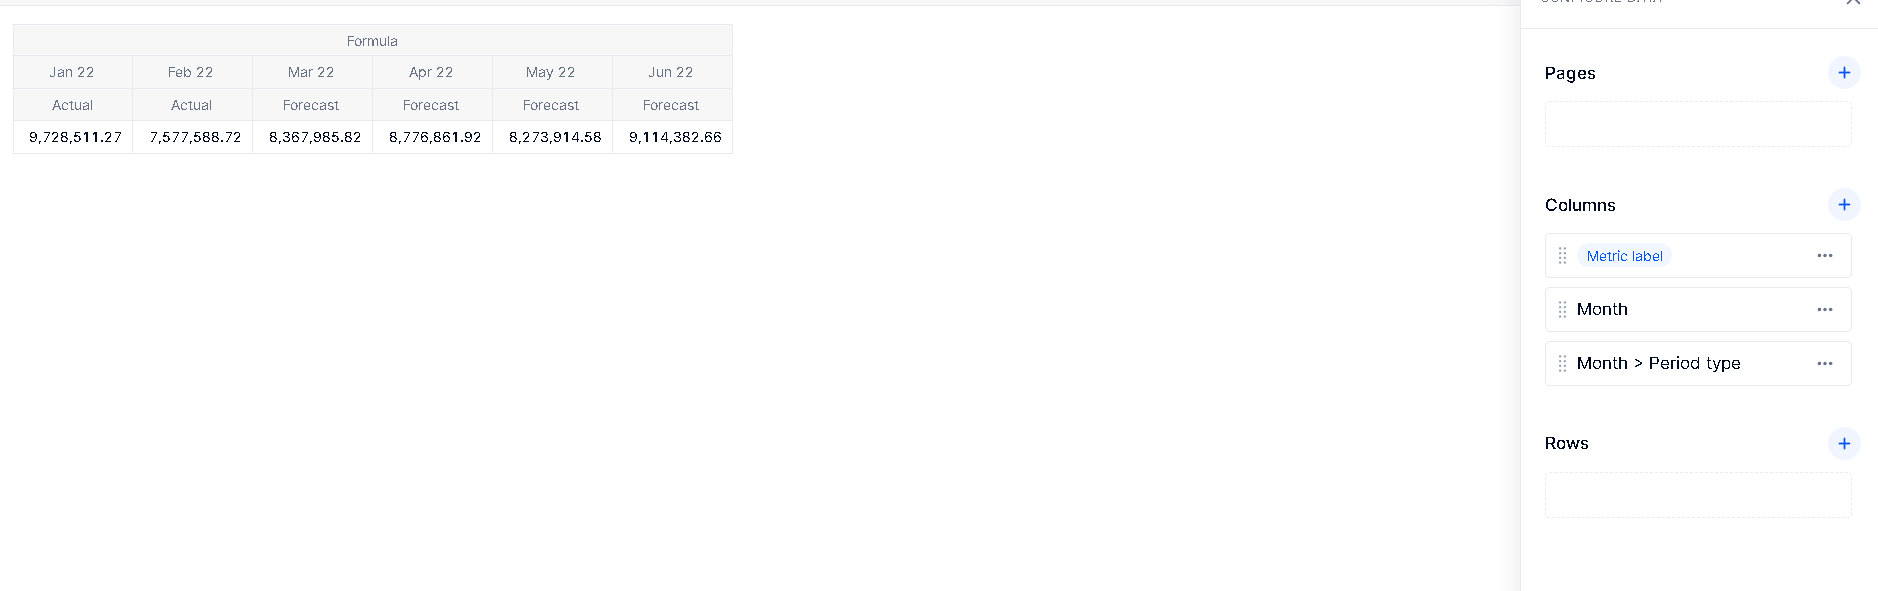
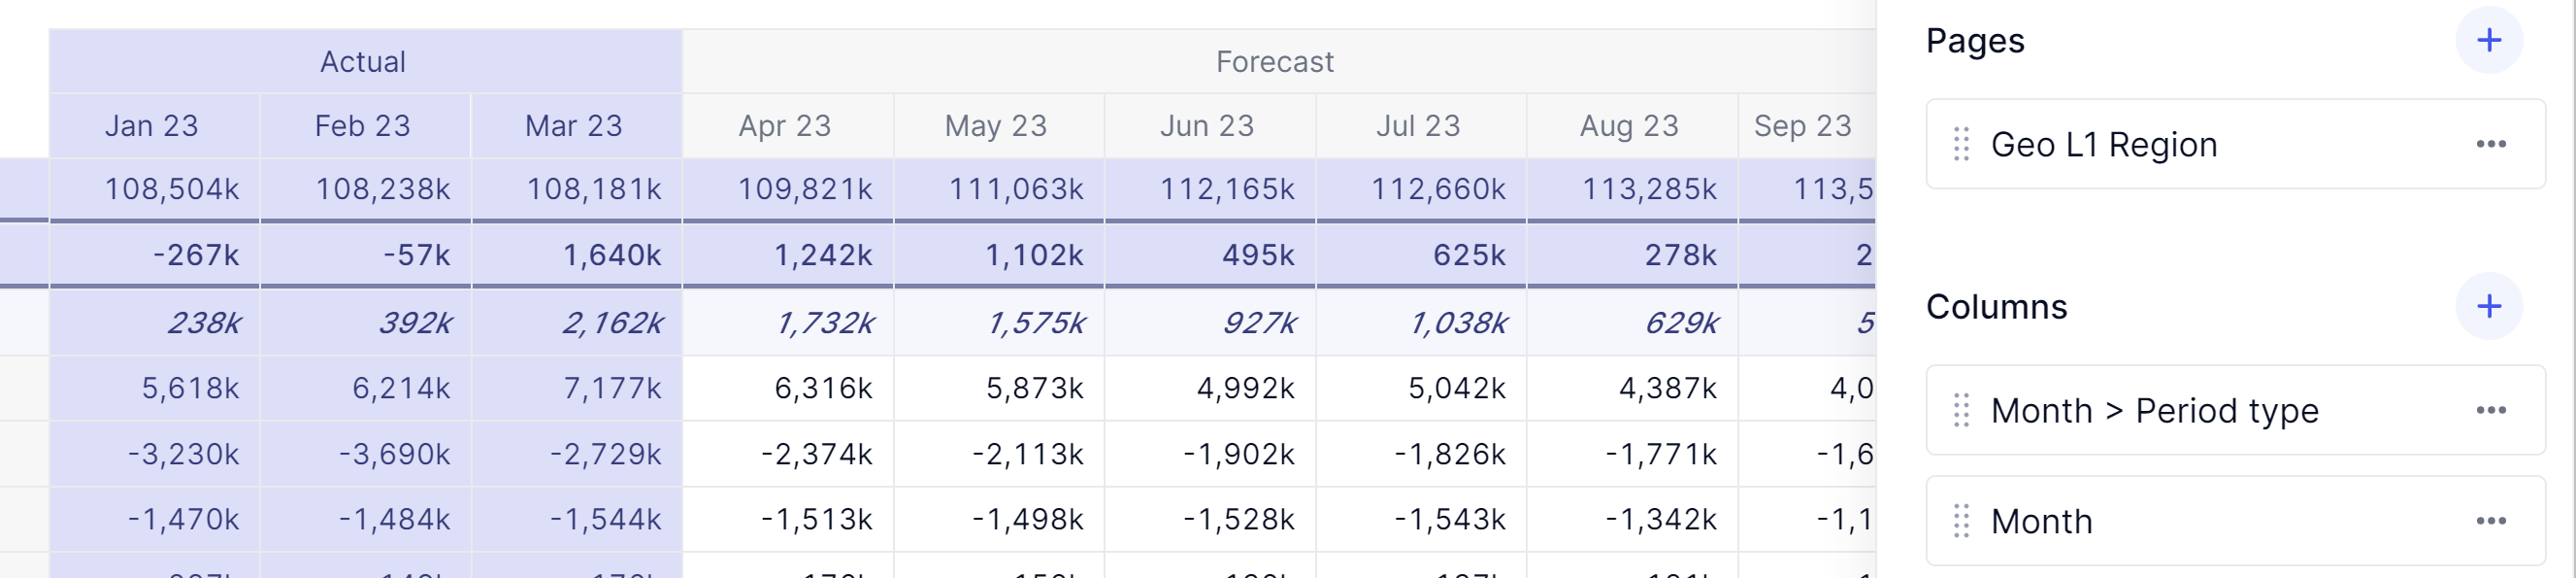
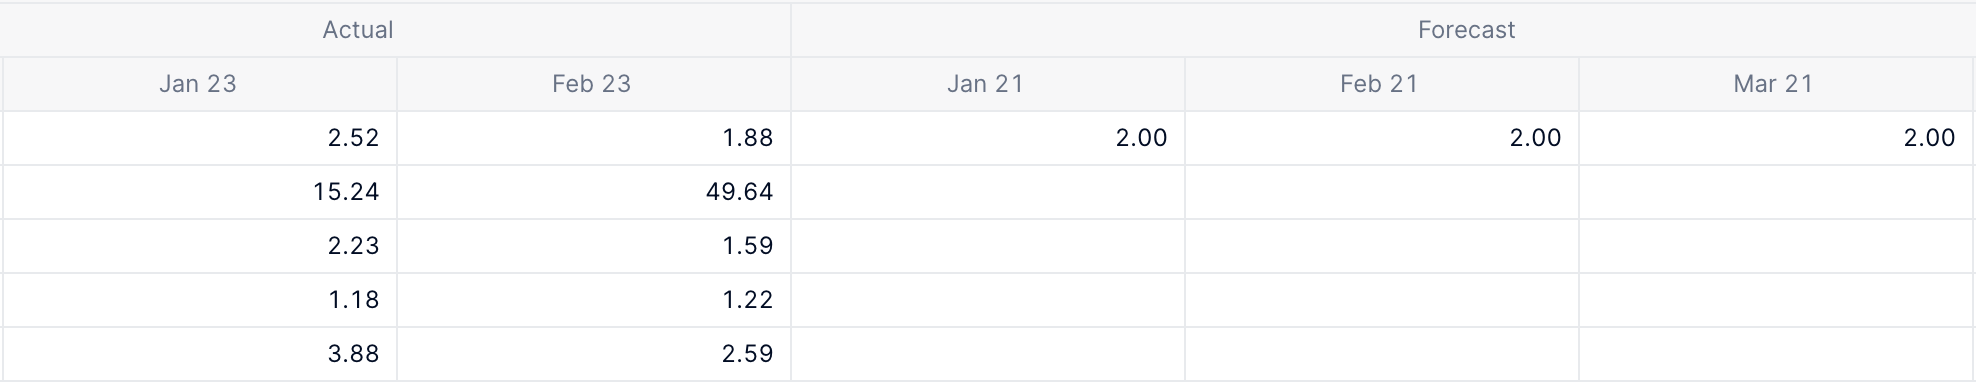
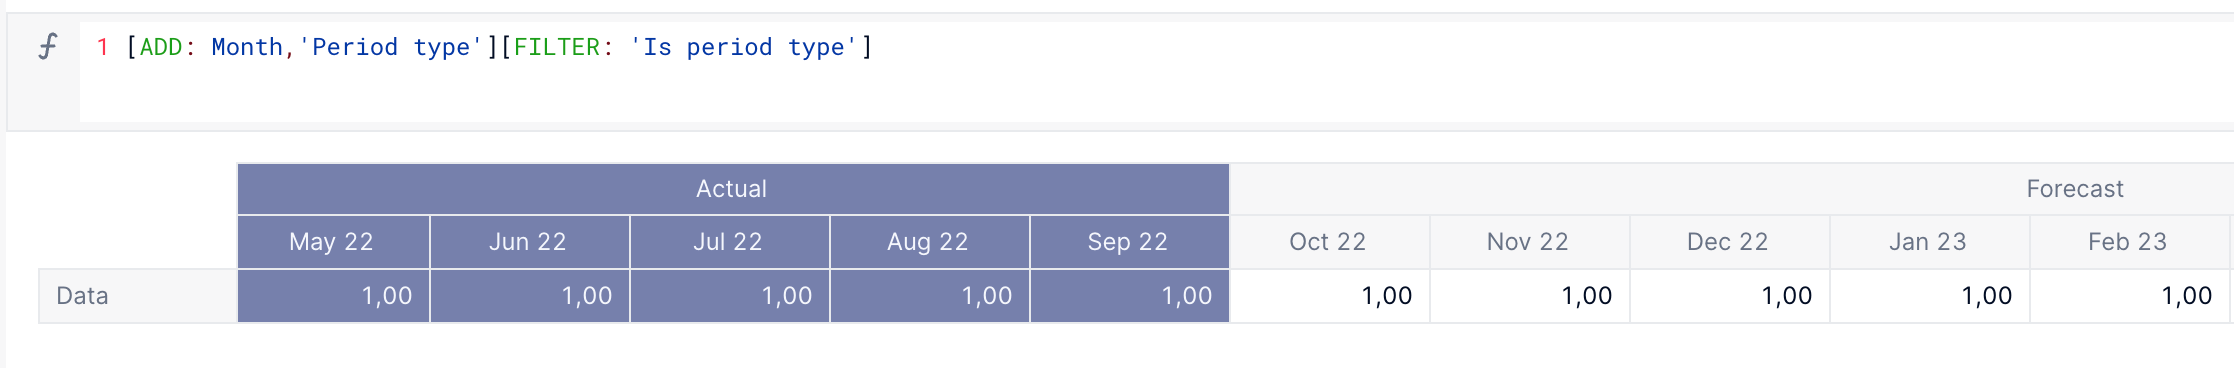
e.g. I have 6 months, and 4 of them are actuals. I want to show the month and period type in the column titles, then my data:


                 Sep 23                Oct 23               Nov 23              Dec 23                Jan 23                   Feb 23

                 Actual                 Actual                Actual               Actual                Forecast                Forecast

Row 1        ###                   ###                     ###                  ###                    ###                          ###

Row 2

Row 3

etc.

icon

Best answer by Oliver 20 February 2023, 10:12

View original

6 replies

Userlevel 4
Badge +6

Hi @Trever Leavenworth 

First, you need to provide Date of Month, From you would like to define Forecast.


After that you need to add Month>Period Type in your column by available pivoted option in metric or Table. Screenshot is attached herewith for your immediate reference.

Hope this will help to get the view as you want.


Thanks 

Abhilash Sawla


Userlevel 7
Badge +13

Hey @Trever Leavenworth ,


If you put the period type on top of months in the pivot, I find it easier to identify where you switchover from Actuals to forecasting.  You could also add some color to help business users quickly see which period is which.   Here is a screenshot with some dummy data. 


Userlevel 3
Badge +5

Ah the Month > Period Type is what I was missing. Thank you both!

Userlevel 3
Badge +5

In your setup @Chris , how is Month > Period type structured? I have “Period Type” as a Property of my Month calendar dimension, but I don’t see the ability to add that property as a pivot item?

Userlevel 3
Badge +5

Or, asked differently, here’s my problem:


Because prior forecast values are preserved in the forecast metric, they aren’t filtered via “hide empty columns” like the actuals are. Here we leave off in Feb 23 with Actuals and pick up in Jan 21 with Forecast.

Userlevel 2
Badge +1

Hi Trever,


If you want to add the Month > Period type property in your pivot you need first to remove the Period type dimension from your view because you can’t have the same dimension twice in your view.


If you want to keep the Period type in your view crossed with the month dimension you can then add a filter metric in boolean with both month and period type dimension and add a formula to check Actual months and forecast month like this :


Add this metric to your table and use it as a filter on month dimension.


Another solution would be to create another metric and use a [FILTER : boolean] directly in your formula (you can reuse the Is period type metric) to BLANK Actual months in Forecast period type


Regards,

Olivier

Reply