Solved

Year-Over-Year Moving Average Calculation

  • 17 November 2023
  • 2 replies
  • 428 views

Userlevel 2
Badge +3

Hi Pigment Community!

I am trying to create a year over year moving average but can’t seem to figure it out. I was wondering if any of you had some suggestions for me. 

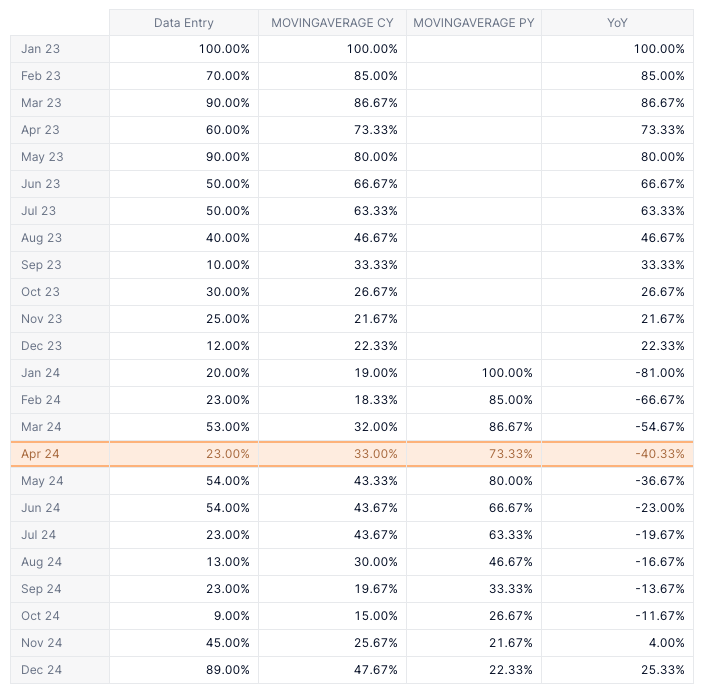
The issue I am trying to solve is that I have a conversion rate calculated in a metric. Using that metric I would like to calculate the difference in moving average between the current year and previous year. Formulaically it would be: (Moving Average Current Year) - (Moving Average Previous Year) * 100. In addition I want to incorporate my switchover date so that my metric will continuously update itself as new information comes in. 


Currently I have this formula in mind, but it doesn’t work. Perhaps there’s a better way, or my formula could be tweaked. 

MOVINGAVERAGE('[ % ] Opportunity to Customer', 3) - MOVINGAVERAGE('[ % ] Opportunity to Customer', 3, 0, '[ % ] Opportunity to Customer'.DATE(YEAR(EDATE('Switchover date', -12)), MONTH(EDATE('Switchover date', -12)), 1)
Opportunity to Customer - Metric

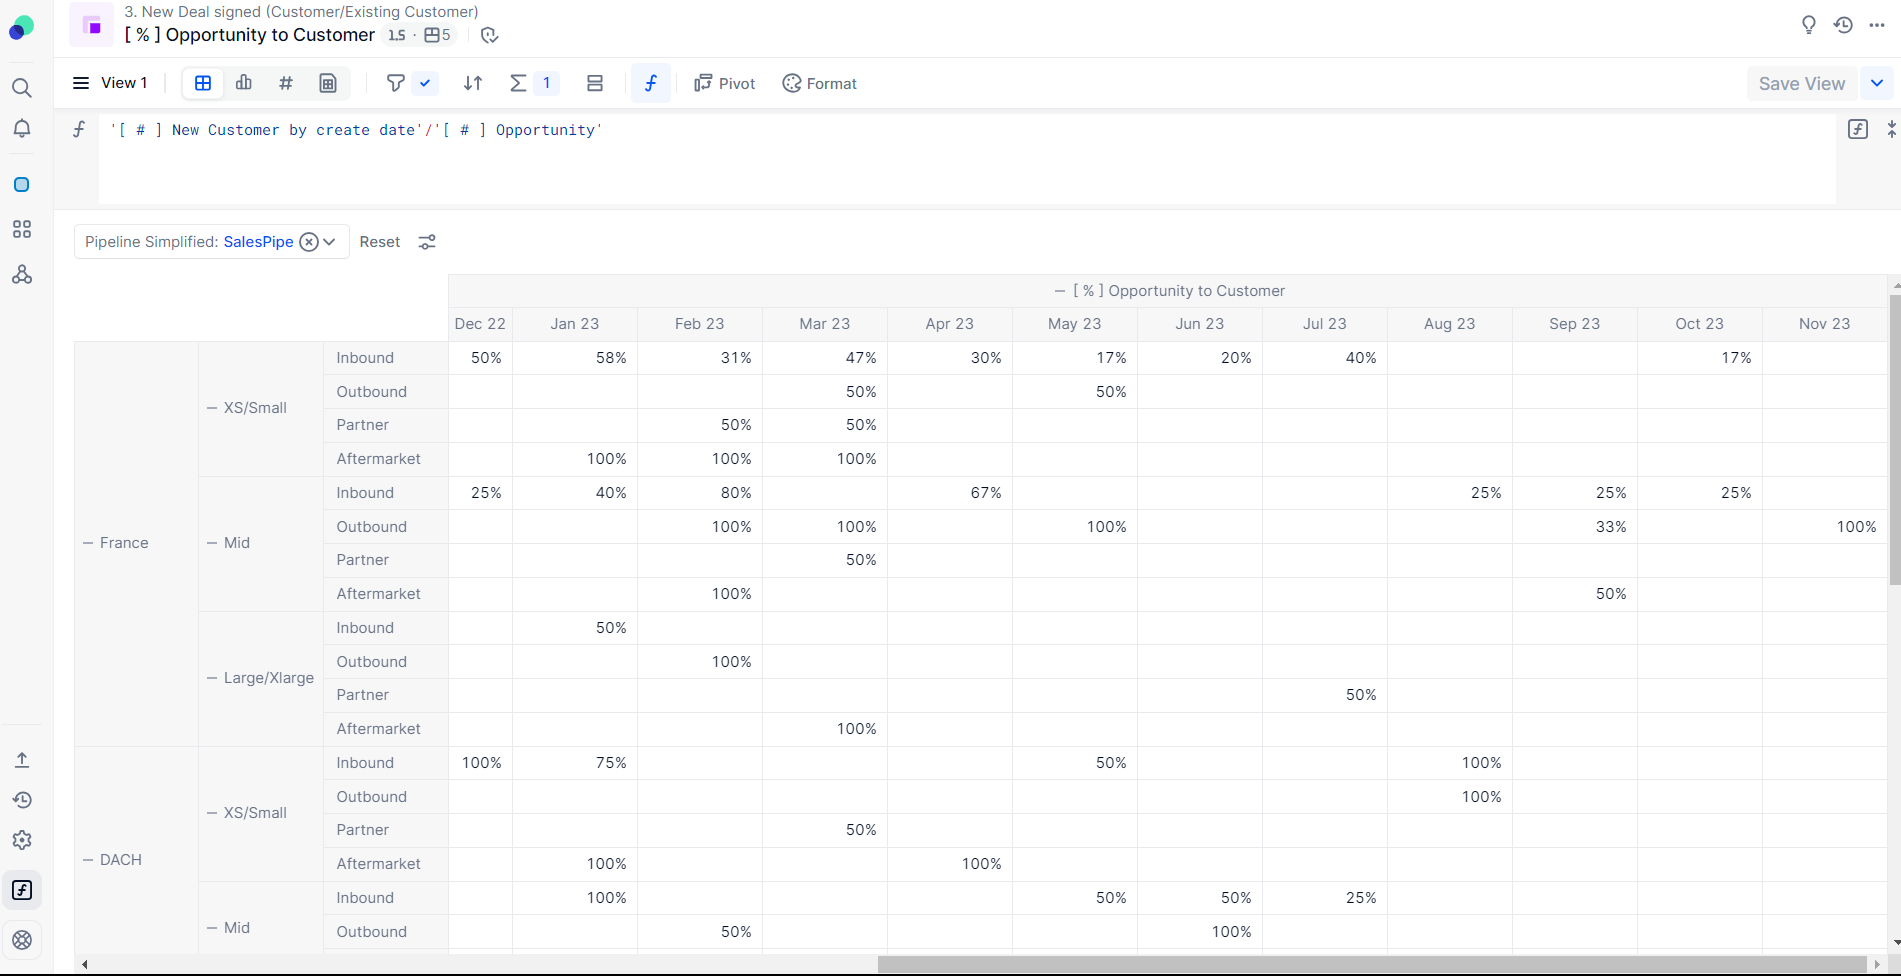
What I envision is: ((Nov 2023, Oct 2023, Sep 2023) / 3) - ((Nov 2022, Oct 2022, Sep 2022) / 3)) * 100


I would greatly appreciate your insights and suggestions on refining the formula or exploring alternative approaches to achieve the desired year-over-year moving average calculation. If you have any expertise in this area or have encountered a similar challenge, your guidance would be invaluable.


Thank you!

icon

Best answer by BrunoRodriguez 19 November 2023, 21:05

View original

2 replies

Userlevel 3
Badge +6

Hello @darious ,


Let’s see if I understood it correctly.

You have a metric which contains a certain conversion rate and you want first to calculate the average of the last 3 months of every month and subtract the equivalent from the previous year. Please find the example that I am going to try to walk you through below:


Each metric represents the following:

  1. Data Entry: The conversion rate metric.
  2. MOVINGAVERAGE CY: The moving average for the current year - your FY23 data.
    1. MOVINGAVERAGE('Data Entry',3,0)


  3. MOVINGAVERAGE PY: The moving average for the previous year - your FY22 data.
    1. MOVINGAVERAGE('Data Entry',3,-12)
  4. YoY change:
    1. MOVINGAVERAGE CY - MOVINGAVERAGE PY


If we take the example data for Apr 24, MOVINGAVERAGE CY represents:

  • (Feb 24 + Mar 24 + Apr 24) / 3
  • (23% + 53 % +  23%) / 3 = 33%.

Meanwhile, the 73.33 % represent the equivalent for the previous year.

  • (Feb 23+ Mar 23 + Apr 23) / 3
  • (70% + 90 % + 60%) / 3 = 73.33%

The YoY is therefore 33 % - 73.33 %, which is the -40.33 % that you see in there.


Would this solution fit your requirement? Please note that the 3 in the formulas define the window that you are going to be considering for the movingaverage, where as the 0 and -12 define from where they start.


Cheers!

Userlevel 2
Badge +3

Hi Bruno, your solution is exactly what I was looking for thank you! 

Reply