


There are different ways that all users can interact with grid views and charts that are published to a board. This article discusses some of these options and permissions necessary to make changes for other Members.
Table of Contents
How to adjust views of Widgets on Boards
When working with widgets on a Board, there are several different options that are available to Members. These options are accessible by right-clicking on the grids, in either the headers or cells. Some of these options modify the view that the widget was published with. You will see “View edited” next to the widget’s name when a view is modified.
These changes are only visible to the Member who made them until they are saved or the active session expires.
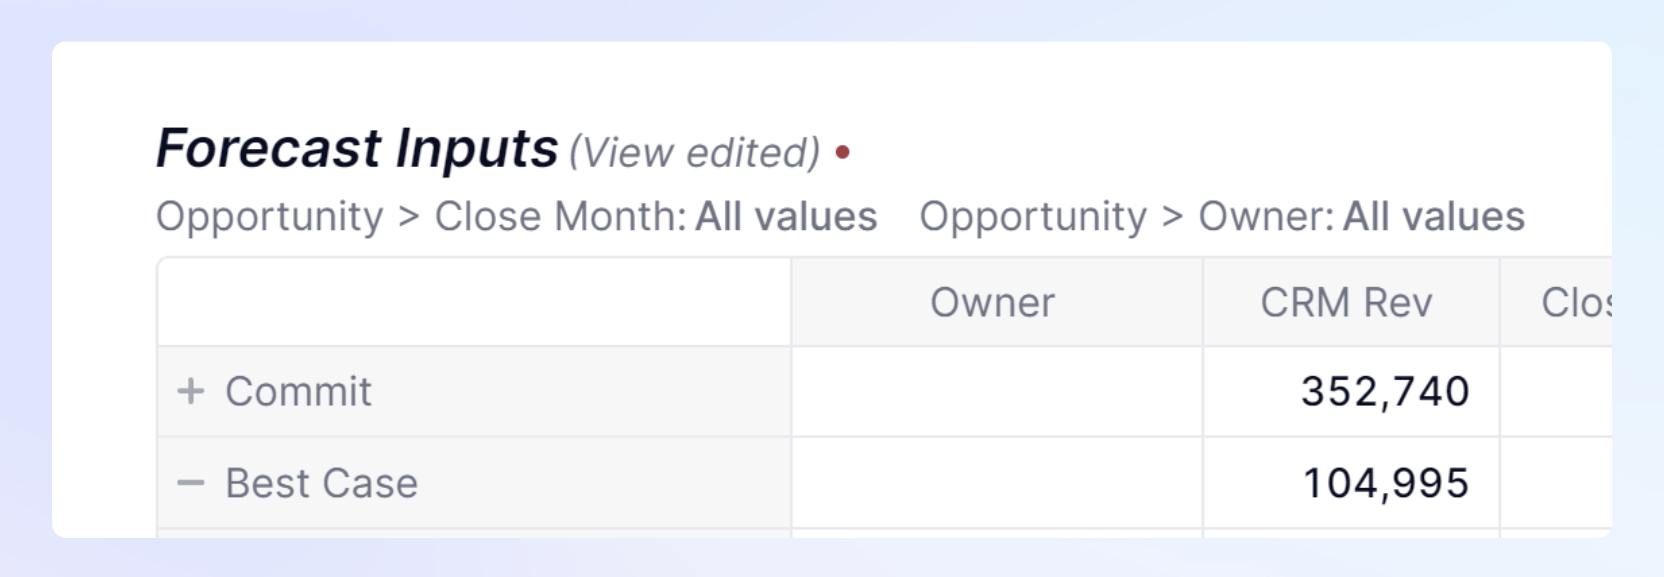 | Once a view is edited, you will see (View edited) next to the widget. There will be a red dot next to this if you have the ability to save this view. |
How to save edited views
Members must have Configure Views permission to be able to save Public views. However, all members can save personal views. Check out this article for more info on Views.
When you modify a view on a Board or in the expanded view. There are different options that appear, Reset my View changes, Save this View, Save for all Boards, and Save as.
- Reset my View changes - resets all view adjustments and restore to the last saved view. This is only for view modifications and does not impact input data.
- Save this View - saves the modifications to that view.
- Save as new personal view - saves a personal view that can only be accessed by that Member.
- Save for all Boards - this prompt lets you know this view is used in multiple widgets. If you save, the changes appear in all instances where the view is used.
- Save As - will create a new view and prompt you to name this new view. It will adjust the widget to the new view and will not impact other areas the original view is used.
Options available for all Members
Expand and Collapse
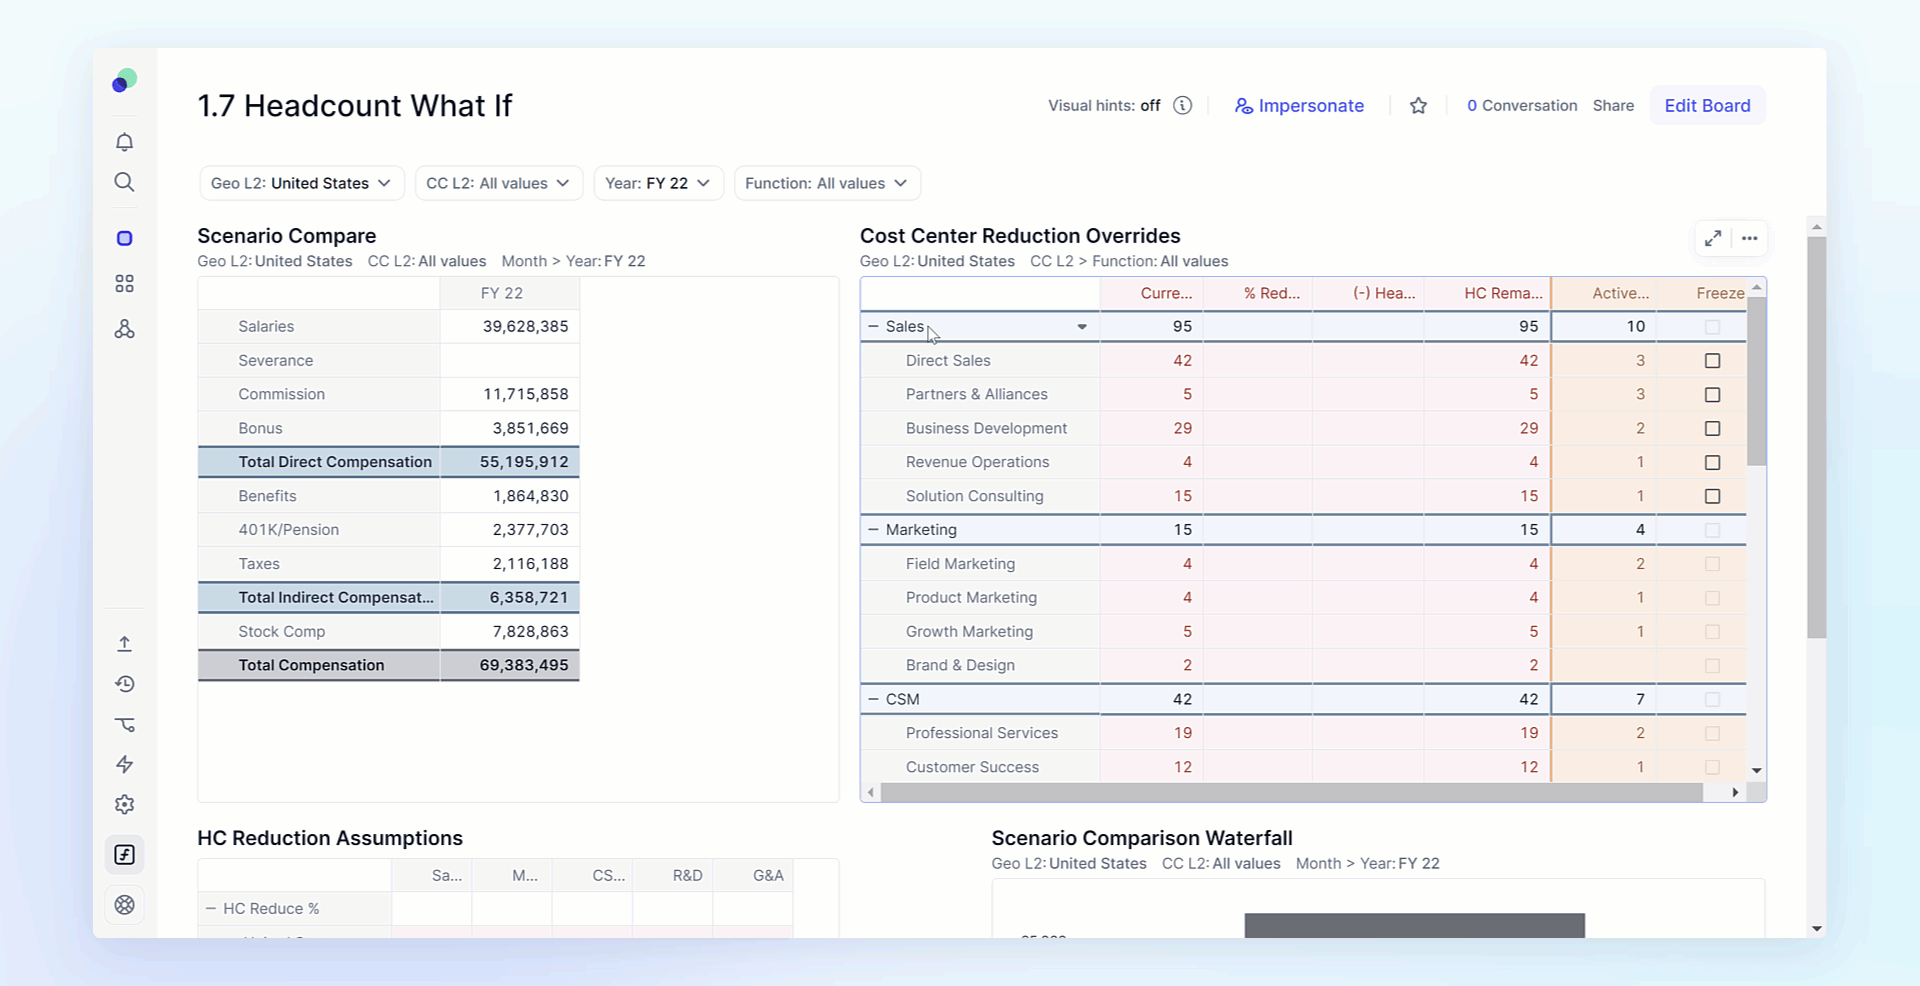
Members can expand or collapse column and row headings by clicking on the + or - icon within the headers. Members can also right-click on the Header and choose to Collapse or expand all the items or Metrics within that header.
Set as Page
| Using Headers in Tables and Metrics When working with Boards, you can change a page selector by right-clicking on a dimension item within a header and selecting Set as Page.
| 
|
| Using Charts If you have a dimension as a Page selector, that is also on a chart, you can click on any item from that chart and hit Set as Page to set that item as a page selector. If your chart is displaying multiple dimensions as page selectors, it will apply to all of them. | 
|
| Using Cells Right-click on a cell to bring the dropdown and select “Set cell context as page” to adjust your page selectors to the same dimensionality that the cell is located in. In the example, the L3 regional selector adjusts to Southeast because that is the L3 region for the cell that is selected. | 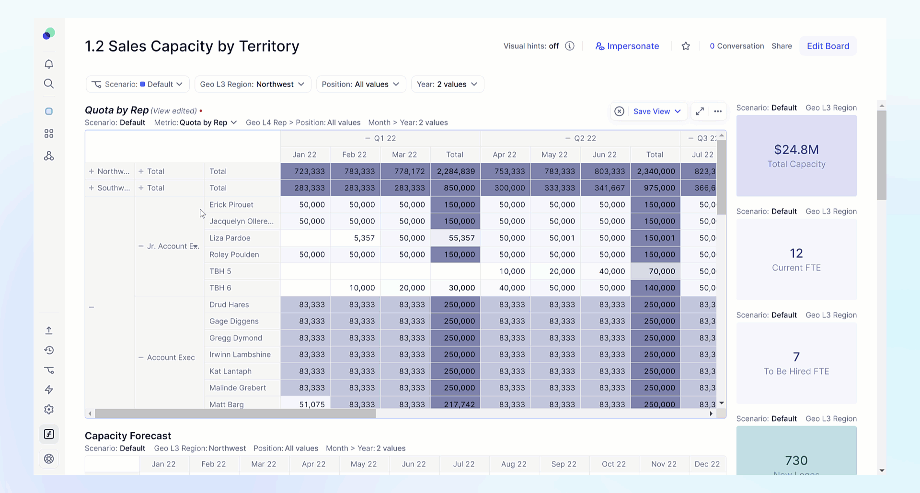
|
Sort
Sort is an available option when you right-click on a dimension header. In the drop-down menu you will say Sort [dimension name] by. This option allows you to sort the dimension in ascending and descending order based on the value shown or you can choose to sort by a property of that dimension.
Export as PNG / Copy to clipboard
You can Export any Widget as a PNG or copy it as a PNG to your clipboard. Hover over a widget, then select the more options button (...) to be able to access to Copy to clipboard an Export as PNG options.
Download Data
You can download data directly from a widget. Hover over a widget, then select the more options button (...) then select Download data and choose between Comma Separated Values (.csv). Microsoft excel (.xlsx), or Microsoft Excel .(xlsx) not formatted. Learn more about Downloading data.
View Customization Options
Format cells
Right-click on the cell you want to format and you will see all the options available. If you want to select more than one cell, hold down Command / Control key and you can select more than one cell. Once you select the formatting options, these cells will start pulsing to indicate which have been selected.
Learn more about static formatting options.
Conditional Formatting
Conditional formatting allows you to format cells based on the values within the cell or cells. This option is only available when right-clicking on headers.
Learn more about conditional formatting.
Show/Hide total
Show total allows you to use aggregators to set up totals and sub-totals on your view. The different options are based on the type of data you are trying to aggregate. If already activated, you will see a Hide total option.
Learn more about aggregation totals.
Update Header Label
Right-click on a dimension or dimension item within a Table or Metric and you can update the header label with list properties as long as they do not have a Date or Dimension data type.
Rename
This feature will rename the Metric you have selected. This will only rename the instance of the Metric in the Table.
Hide Item
Hide item is a filter shortcut. When you hide an item, you are adding a filter to the data that will Exclude that item from the view, this does not affect totals.
Learn more about filtering.
Hide Metric
Hide item is a shortcut for hiding a Metric within the Pivot.
Learn more about pivoting.
Add Calculated Item
In Tables or Metrics, a Calculated Item allows you to add a calculation using data from specific items within a Dimension. These formula free calculations come with some preset options depending on which items you select.
Learn more about calculated items.
Add this Metric again
Tables are comprised of Metrics, this option is available when you right click on Metric in a table. It allows you to view the Metric again. This is usually used with the Show Value As option.
Show Value as
If you wanted to compare all of the items in a Metric to items within that Metric or in comparison to items in another Metric, the Show Value As functionality can help you achieve that. This will change how the data is displayed based on the chosen options. You can use Add this Metric again to be able to see the original data.
Learn more about Show value as.
Break down by
Use the Break down by feature to adjust the view of a Metric within a Table so that you can see more details on the lists or dimensions that make up that calculation.
Learn more about Break down by.
Block Exploration Options
Open Block details
Open Block details give you an expanded view of the Metric, Dimension, or Transaction list. This option will appear as Open Metric details, or Open Dimension details. Open Dimension details shows the items that create that Dimension, and all properties. Open Metric Details opens to the default view of the Metric.
Open dependency diagram
The Dependency Diagram displays an overview of a model's structure. It enables you to understand the data flow of a specific Block by showing source and target Blocks (Metrics and Transaction Lists).
Learn more about dependency diagram.
Drill down, Drill down by, and Drill to data Source
These options are available when you right click on a cell within a Metric. These options are used to identify where the source data is coming from for that individual cell. Drill down allows you to see the formula and steps of that formula that were used in the calculation. Drill down by allows you to choose a particular dimension to focus on. Drill to data Source opens up an analysis to show the Metrics, Dimensions lists, or Transaction list items that were part of this calculation.
You can drill down into Charts by left-clicking on a chart.
Learn more about Drill down, Drill down by, or Drill to Transaction
Expand widgets
Each widget has an expand button option on it. When clicked this option will open an expanded view of the widget with additional menu options such as; filtering, sorting, totals, layout, pivot and formatting. There are also option for the Dependency diagram, Importing. Block settings, Block updates, and Impersonate.
How can I tell what type of Block a widget is?
Lists, Tables and Metrics can be published to a Board and appear to be similar to a Grid. To identify if you are interacting with a List, hover over the Widget on a Board and select the expand icon. You’ll see an icon in the top left that indicates the block type In the expanded view.
A Green icon is used for Transactions Lists, Blue is used for Dimension Lists, Purple indicates a Metric, and Red is used for Tables.
Metric Settings
Metric settings will open up the details of the Metric. Depending on the permissions a Member has, they might see different options.
General - Highlights the name, folder, description and the ability to create duplicates.
Structure - Shows the data type, input options and the dimensions that make up the Metric.
Library & usages - gives an overview of where this Metric is referenced and access to the dependency diagram.
Access Rights - provides an overview to the access rights configurations that determine which users can read or write data into that Metric.
Import Configurations - shows any saved configurations that were used when importing data into Pigment.
Delete - Option for deleting a Metric.