


If you wanted to compare all of the items in a metric to items within that metric or in comparison to items in another metric, the Show Value As functionality can help you achieve that. If you are looking to compare two items within a list, check out this article on how to use Calculated Items. In this article, we will discuss, how to set up Show Value As, configuration options, and a few examples.
Accessing the ‘Show Value As’ Option
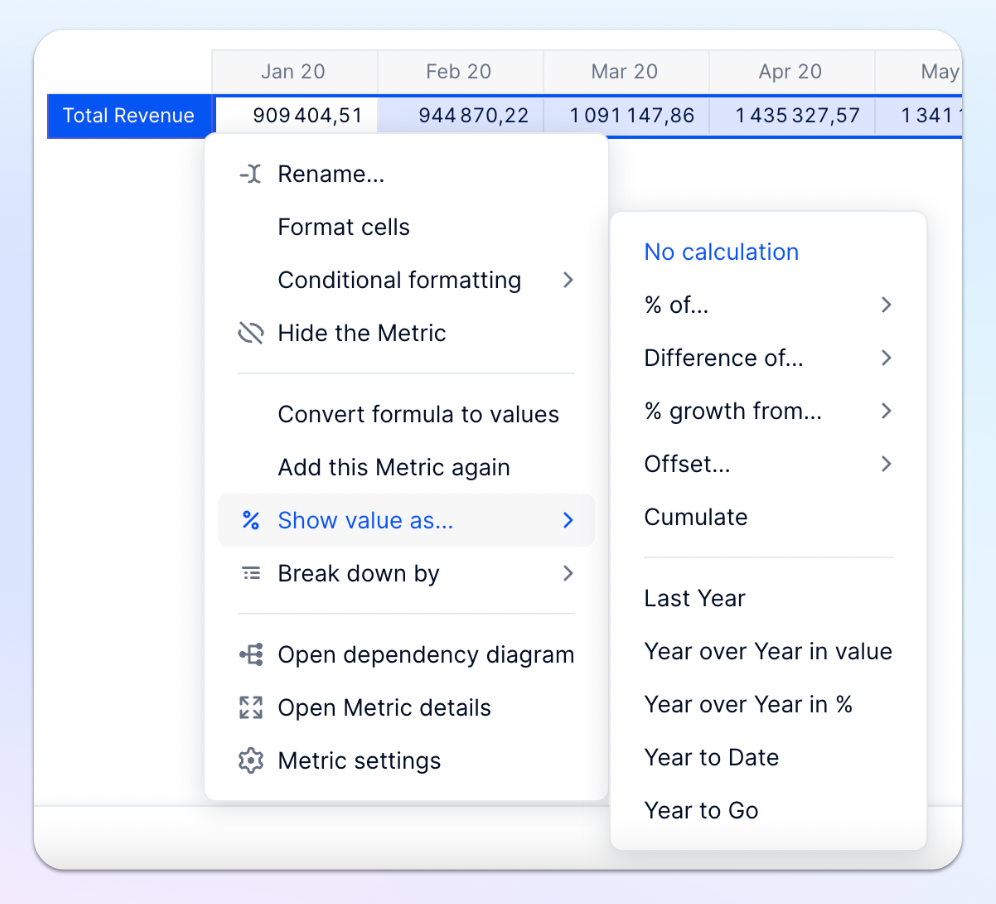
Show Value As can be used in Metrics alone or as part of a Table. It is important to note, these calculations can not be referenced by other Metrics using formulas. These Metrics must have a data type of Number or Integer. To access, simply right-click on a metric to bring up the menu, you can also select a drop-down icon that appears on the right side of the metric when you hover over it.
After you apply Show Value As to a Metric, you can click Edit Show Value As in the header menu to make any changes, or Remove Show Value As to remove it.
Types of calculation
Let's take a look at each calculation type with some examples. You will notice that there is a No Calculation option at the top, this will remove any Show Value As calculation that may have been applied to a metric.
% of …
‘Percentage of’ calculates the percentage of each item with the Metric value as the numerator and the denominator later defined. When defining the denominator, the number at the bottom of a fraction, you are given a few options.
- Grand Total - This will calculate the total value of all items within a metric to determine the value of the denominator.
- Previous Item & Next item - You can also calculate the percentage of an item as compared to other items based upon their position. Previous Item compares to the item before and Next Item will compare to items after. When you select this option, you will be given the option to choose, which dimension you want to compare and how much you want to offset by. When choosing the dimension, the dimension must be present on either a Row or Column.
- Specific Item - This allows you to select an item within the metric to compare all other items too.
- Metric - You can compare items in a metric to other items from another metric from within the table.
% of Parent totals
% of Parent totals allows you to take an item's value and divide it by the value of the parent total. There are three different options when defining the % of Parent totals. Parent total allows you to choose which dimension defines your total, while Parent column total and parent row total are based on which dimension is located directly above the most granular dimension.
- Parent total - This option opens a configuration panel where you will be able to choose the dimension used in the denominator. Your options are dimensions or grouped dimensions that have been added to the pivot.
- Parent column total - this option will choose the dimension or grouped dimension that is located above the most granular dimension in the column of the pivot.
- Parent row total - this option will choose the dimension or grouped dimension that is located above the most granular dimension in the row of the pivot.
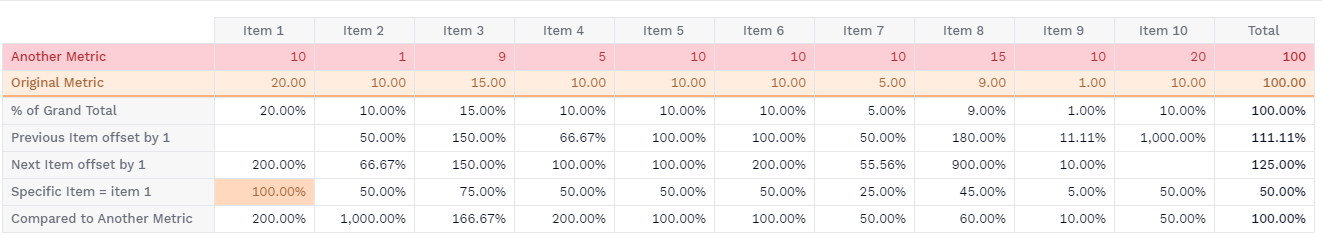
Here is an example Table called Percentage of. In this Table, Original Metric represents the metric we have applied Show Value As on, Another Metric represents the one we compared to.
How to read example tables
In the example tables, Original Metric represents the metric we have applied Show Value As on, Another Metric represents the one we compared to. All other metrics were created by selecting Apply as new, effectively making a copy of the metric so we could see the original and once Show Value as is applied. After creating a new Show Value As, you can select Apply as new, to create a copy of the metric. When using Specific Item the item chosen was always Item 1. Totals were also added to help clarify.
Difference of
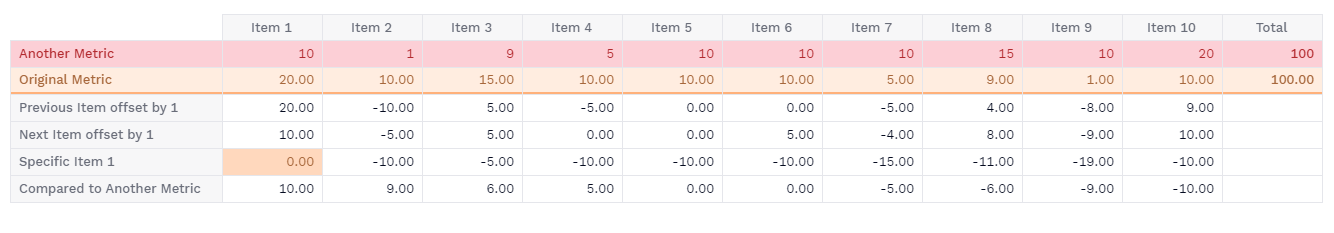
Difference of calculates the difference between an item in a metric and another number later defined through subtraction. When defining which number to subtract, you are given a few options.
.
- Previous Item & Next item - You can calculate the difference between an item as compared to other items based upon their position. Previous Item compares to the item before and Next Item will compare to items after. When you select this option, you will be given the option to choose, which dimension you want to compare and how much you want to offset by. When choosing the dimension, the dimension must be present on either a Row or Column.
- Specific Item - This allows you to select an item within the metric and subtract the difference between that item and all others separately. In the example below, the Specific item chosen is Item 1.
- Metric - You can subtract the values from Another metric to figure out the difference.
Sum with
Sum with calculates the sum of an item in a Metric and another number later defined. When defining which number to add, you are given a few options.
- Previous Item & Next item - You can add an item and onther other items based upon their position. Previous Item uses the item before and Next Item will use items after. When you select this option, you will be given the option to choose, which dimension you want to compare and how much you want to offset by. When choosing the dimension, the dimension must be present on either a Row or Column.
- Specific Item - This allows you to select an item within the Metric and combine that item and all others separately.
- Metric - You can add the values from another metric to figure out their combined total.
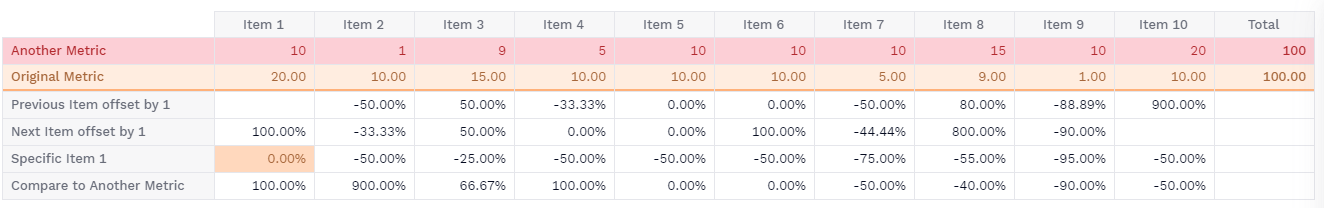
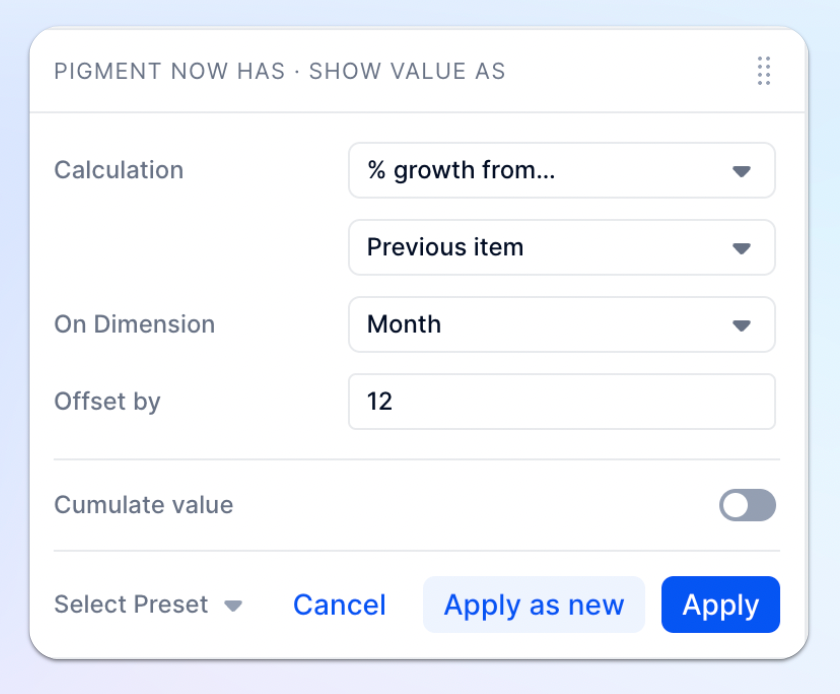
% growth from
% growth from is a two-part equation, first, it takes the new number and subtracts it from the original number to see how much it has grown (if negative decreased), and then it takes that value divides it by the original number.
Lets look at an example. Where the original metric item value is 10 and the compared value is 30.
Compared Value 30 subtracted by original Value 10 = 20 growth. To put that in a percentage, we take the growth value of 20 and divided it by the original value 10 then multiple by 100 to get a 200% growth rate.
- Previous Item & Next item - You can calculate the growth difference between an item as compared to other items based upon their position. Previous Item compares to the item before and Next Item will compare to items after. When you select this option, you will be given the option to choose, which dimension you want to compare and how much you want to offset by. When choosing the dimension, the dimension must be present on either a Row or Column.
- Specific Item - This allows you to select an item within the metric and subtract the difference between that item and all others separately. In the example below, the Specific item chosen is Item 1.
- Metric - You can subtract the values from Another metric to figure out the difference.
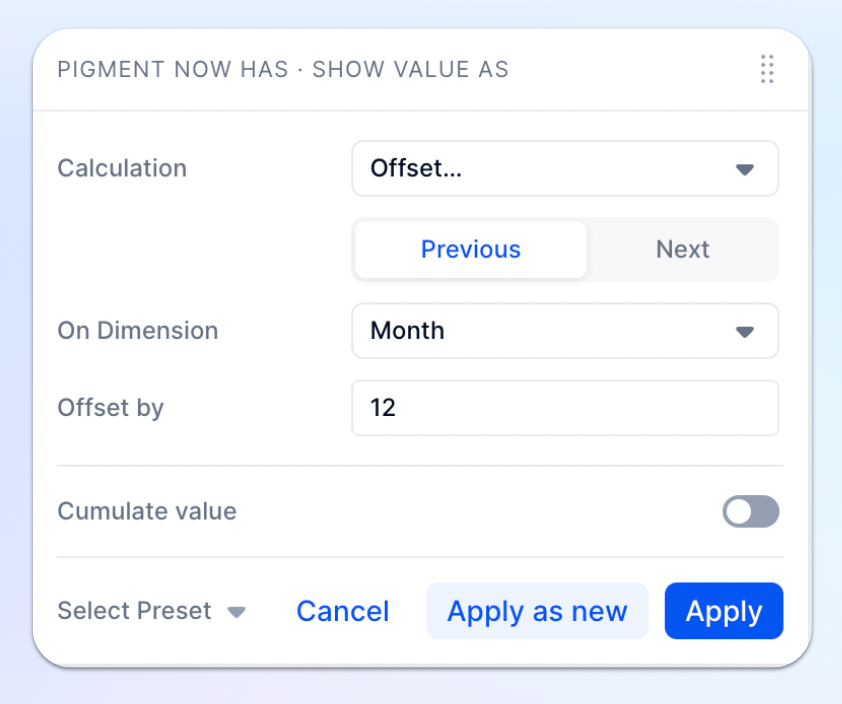
Offset
Offset simply takes an item’s value and moves it over the specified number of cells. With offset, there are only two options, offset based on the previous item or offset the next item. Offsetting values are often combined with other calculations that we will see below.
- Previous Item - When you offset a previous value, you are effectively taking the previous value and moving it forward the number specified.
- Next item - When you offset the next item, you are moving it backward the number specified.

Cumulate
Cumulate allows you to keep a running total, meaning it will start at your first item and keep adding on the additional items. There is also the ability to reset values, meaning it will effectively start over. To reset a cumulate, you can use a Property of the list with the type of Dimension. Within Cumulate, you have the ability to cumulate previous values or cumulate forward values. When you cumulate previous values, you are essentially adding up the values as you go. You do have a toogle switch to decided if you want to include the value of the current item. When you cumulate forward, you are looking at the cumulation of all future values.

Once your calculation is set up, you are able to:
-
Click on Apply if you want to apply the calculation on the existing Metric.
-
Click on Apply New if you want to create a new Metric with the calculation. You will be able to choose a name for the new Metric.
-
Click on Cancel if you want to discard your edits. You can also reset to No Calculations to get the original.
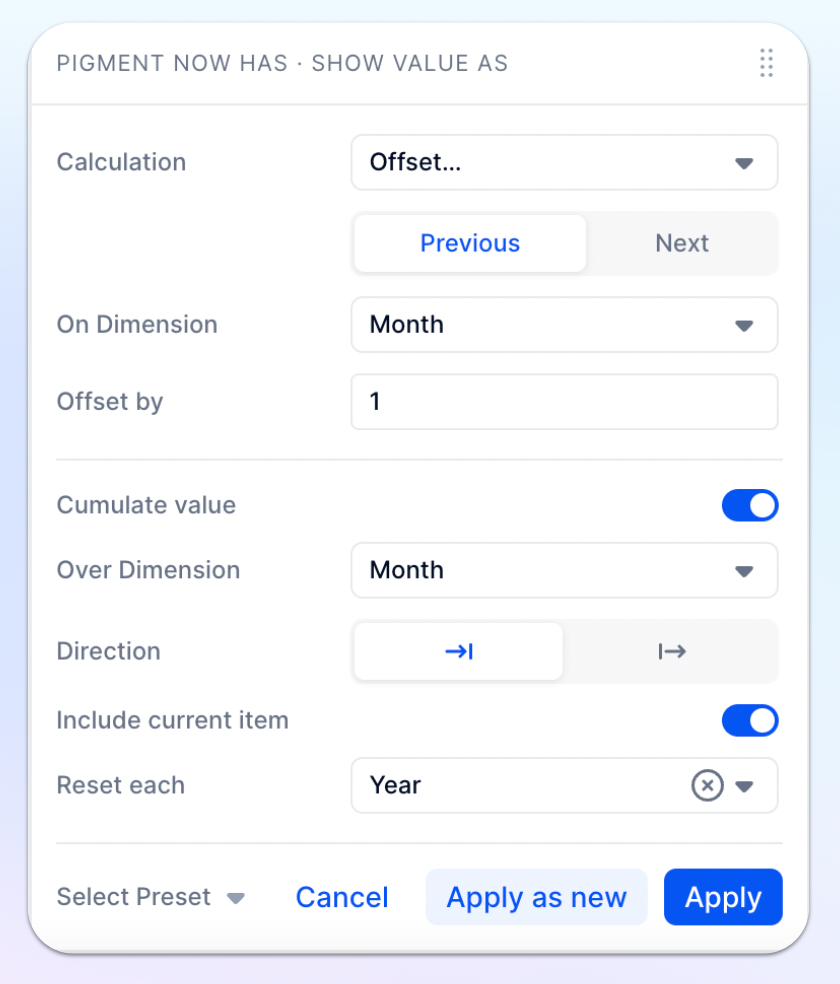
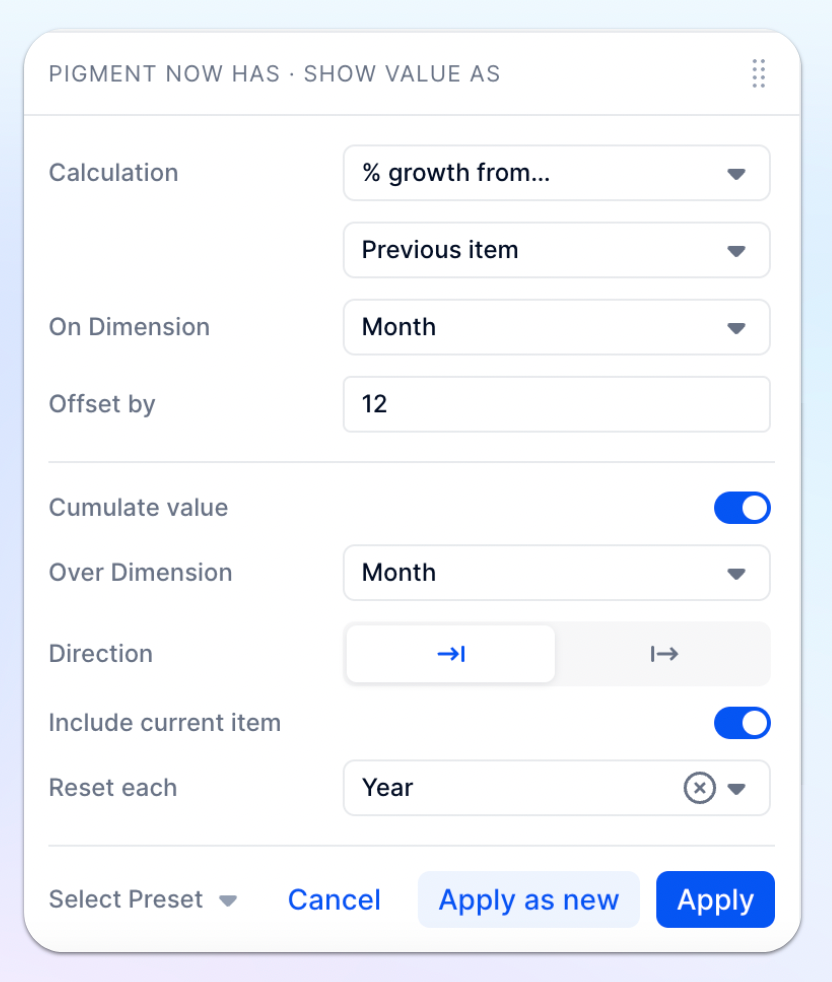
Combining cumulated calculations
For all type of calculations, you are able to apply the operation to a cumulated value of your Metric. To do so, activate the toggle Cumulate Value and set up the parameters that calculates your cumulate:
- Over Dimension: Dimension according to which cumulation is made, it must be present in a Row or a Column.
- Reset each: Property of the Dimension chosen on which you would like to reset the cumulation. The list property type must be set to Dimension
Presets
Pigment has put in place some Show Value As presets for the most used computations. The presets you will be able to load depend on the granularity of your calendar as well as the time dimensions in your pivot, so that you cannot choose an option that can’t be computed. They will be shown in the Show Value as menu, below the various methods of computation, but you will also be able to load them directly from the configuration modale by clicking on “select Presets”.
The list of presets available is constantly evolving and include notably Last Year, Year over Year in value, Year over Year in %, Year to Date, Year to Go, Month over Month, Last Month, Quarter over Quarter, Last Quarter, Week over Week, Last Week.
Calculated Item, Show Value As or Formula?
Year to Date can be calculated in different ways in Pigment.
When using Show Value As presets, such as Year to Date, its important to note that these calculations can not be referenced by other Metrics. To reference the results, use the YEARTODATE function. If you want to get a quick Year to Date for a particular item or up to a particular time period, use the Year to date Calculated Item preset.
Examples
Offset
| Last Year value | Last Year YearToDate value |
|---|---|
| 
|
YearOverYear (YoY)
| YoY Growth | YoY YTD Growth |
|---|---|
| 
|