A waterfall explains the variation between 2 situations. It's useful for understanding how an initial value (for example, Budget) is affected by a series of positive and negative values to get the final value (for example, Actuals). In Pigment we can have different types of Waterfall chart (sometimes also called Bridge chart). In this article you will learn how to build this type of chart.
Table of contents
What are the common options for a Waterfall?
What is the difference between contribution mode and variation mode ?
Building a Waterfall from a Table with multiple Metrics
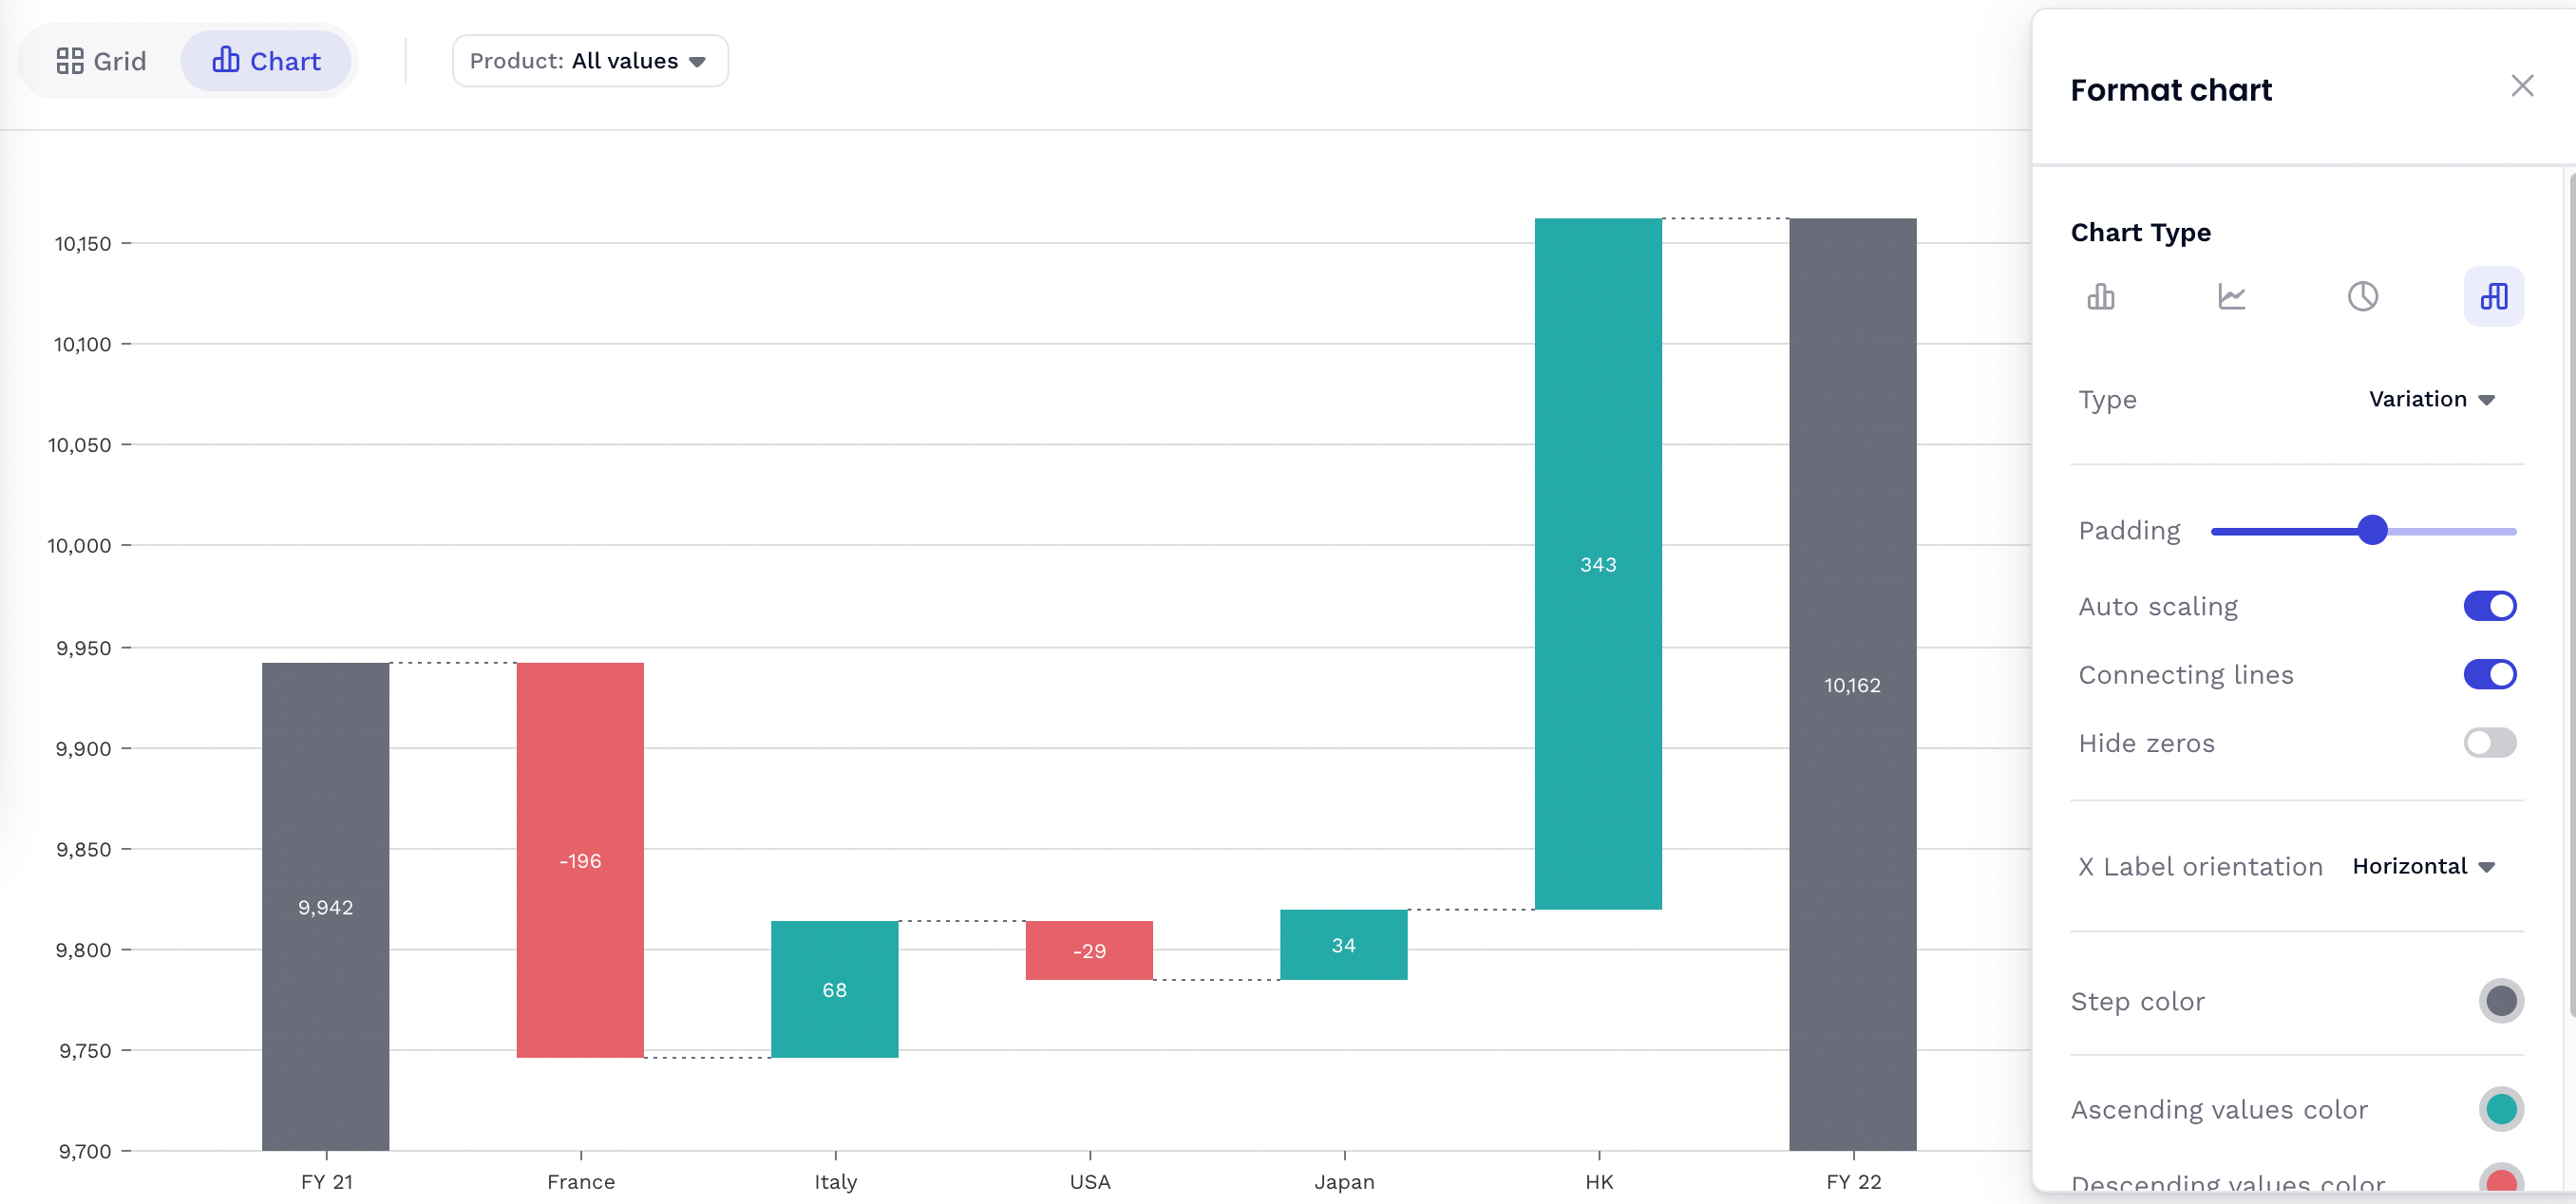
What are the common options for a Waterfall?
| Setting | Description | Options |
| Padding | The padding allows you to play with the spacing between bars |
From 0 to 0.9 |
| Auto scaling | By default, Y-axis starts at 0. If activated, the scale will be inferred from the underlying data. | Toggle on/off (on by default) |
| Connecting lines | The connecting lines option allows you to add dashed lines between the bars. | Toggle on/off (on by default) |
| Hide zeros | The hide zeros toggle allows you to hide the bars with a value of 0. | Toggle on/off (on by default) |
| X Label orientation | The X label orientation setting configures the orientation of the X-axis labels. To avoid label overlap, use the diagonal or vertical option. | Horizontal, vertical or diagonal |
| Step color | Choose the color of your step. | Color picker (grey by default) |
| Ascending values color | Choose the color of your ascending values. | Color picker (green by default) |
| Descending values color | Choose the color of your descending values. | Color picker (red by default) |
What is the difference between contribution mode and variation mode?
We distinguish 2 types of waterfall:
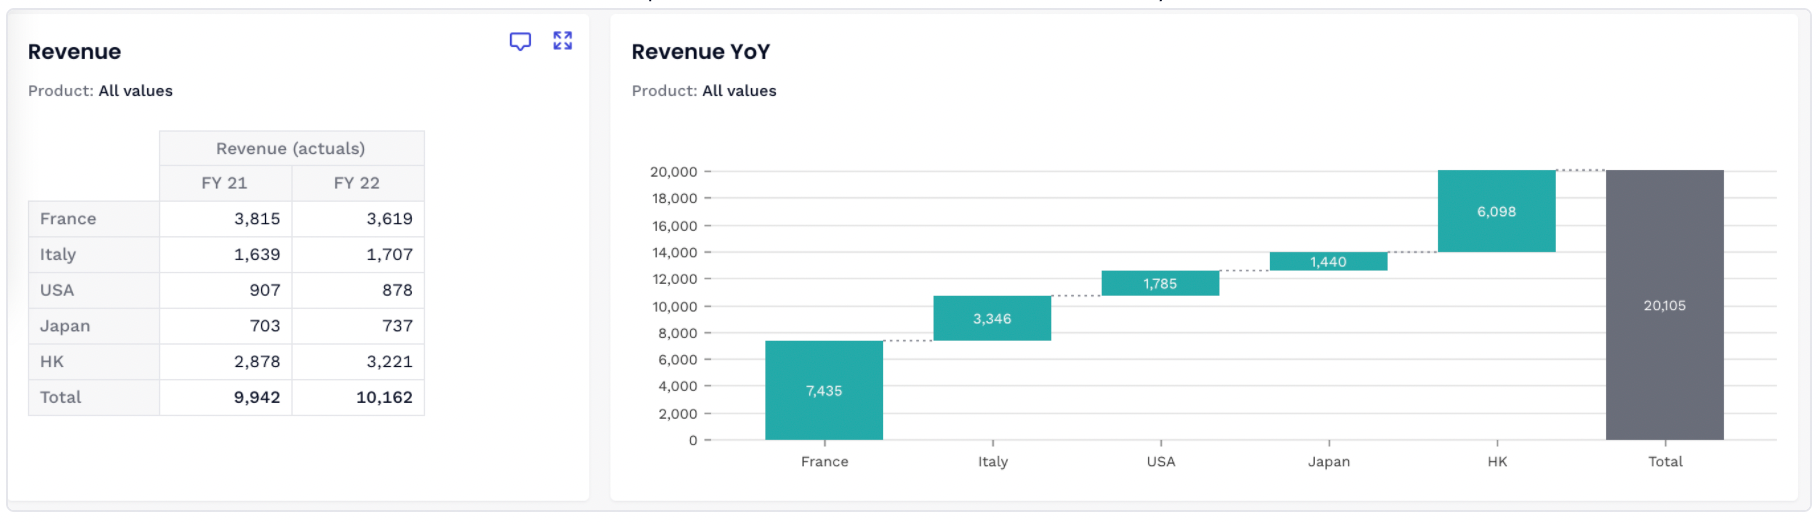
- Contribution waterfall : when the objective is to explain the contribution of each element to the sum (generally Metrics with a unique column, otherwise Pigment sums the data columns to have get a unique column)
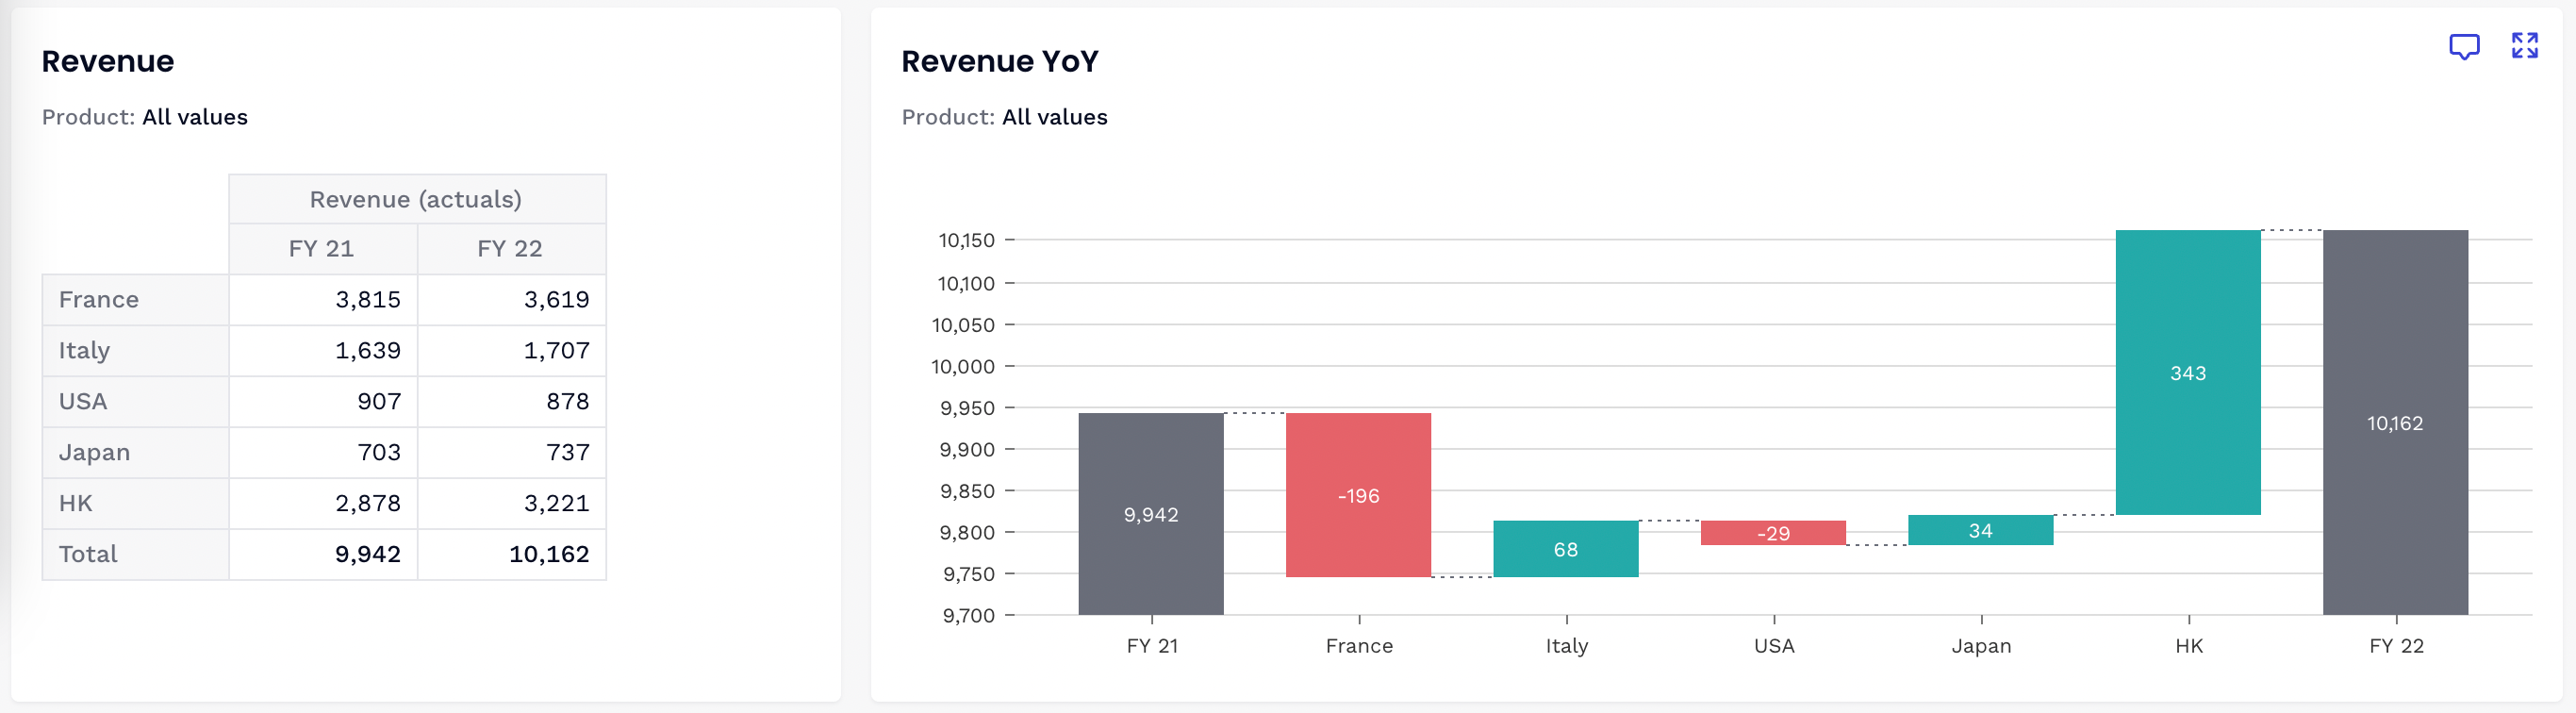
- Variation waterfall: when there is a need to make differences between two columns to get the variation bar values
Example: In the case of a Metric with 2 columns (FY 21 and FY 22), you have a choice between:
- Variation mode which explains the differences between FY 21 and FY 22 thanks to the variation of each country. Adding a new column adds a new step.
- Contribution mode which sums FY21 and FY22 to explain the contribution of each country to the total
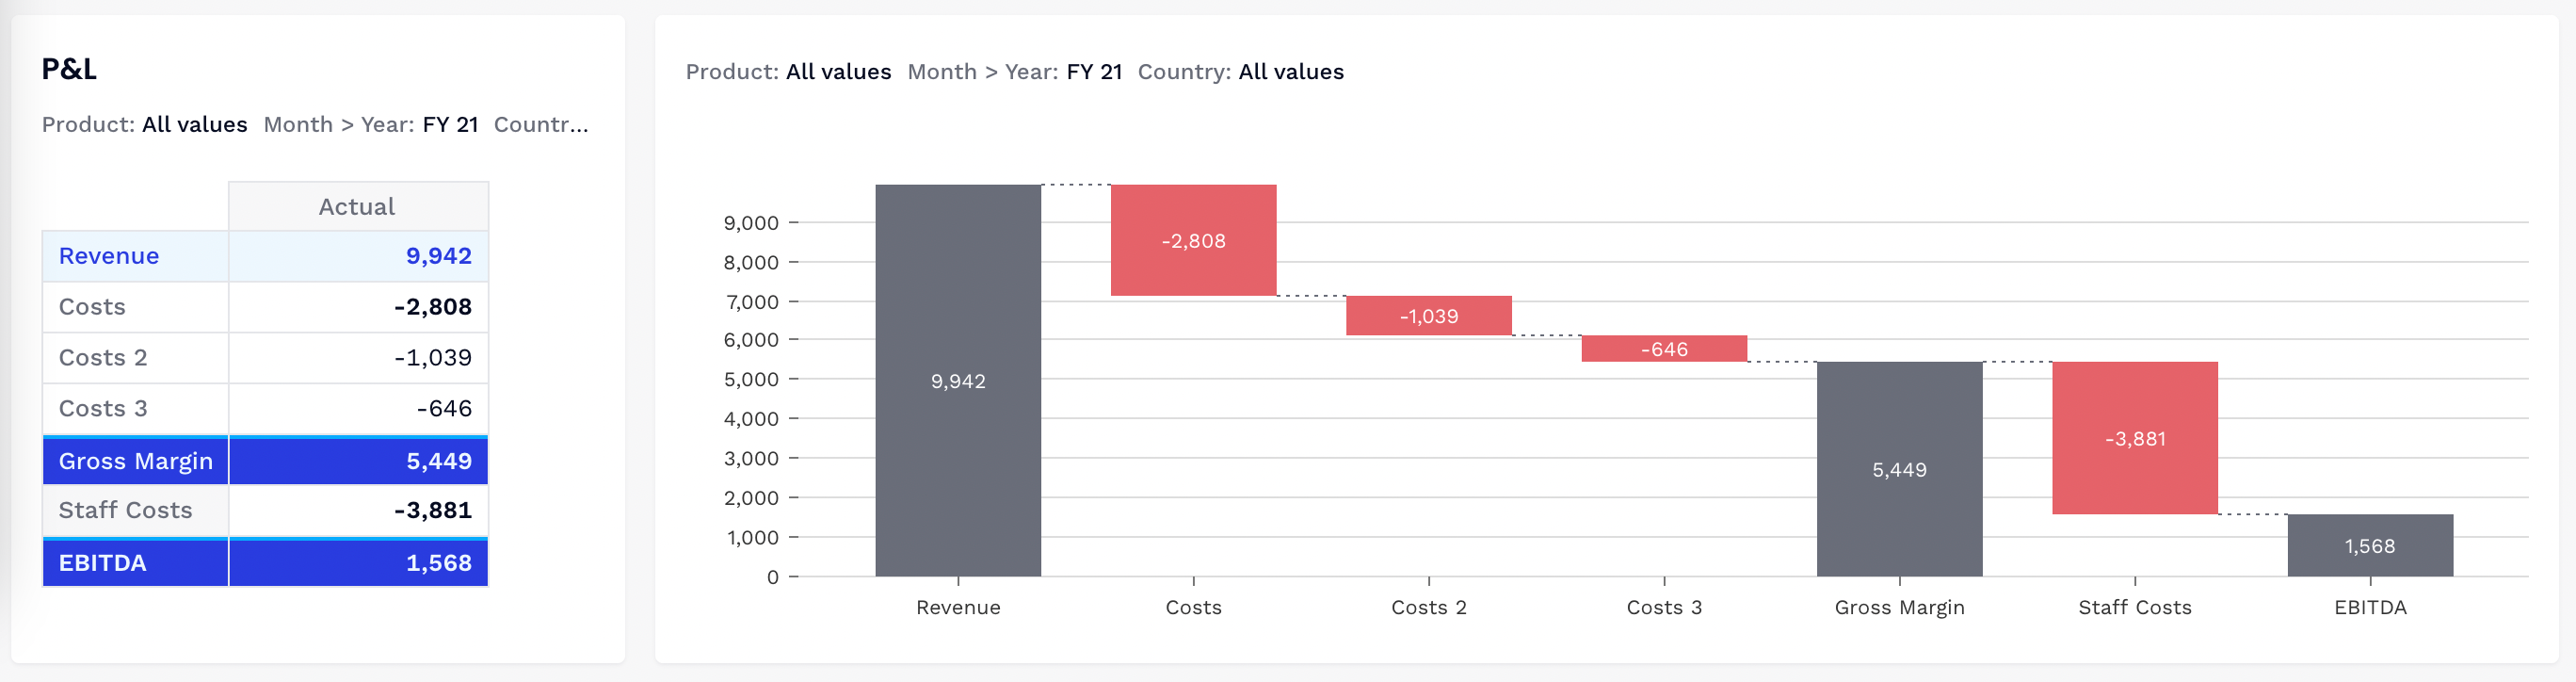
Building a Waterfall from a Table with multiple Metrics
By putting your metrics in rows, the waterfall will automatically choose the first Metric as the initial step and the last Metric as the final step. If your Table contains intermediate sums, use intermediate step to add these Metrics as steps.
How do you add multiple Steps?
In variation mode, adding a new column allows you to create a new Step.
In the case of a Table in contribution mode:
- Add your step in the Table (in the example Gross Margin)
- In the Format panel, add an intermediary Step by choosing the Metric in the dropdown menu