


In many cases you may want to associate a bracket with your data - to cluster clients, products, orders, and better sort your dimensions.
In this example, I want to sort the different car brands sold in the different cities into different clusters, to make further analysis on my data.
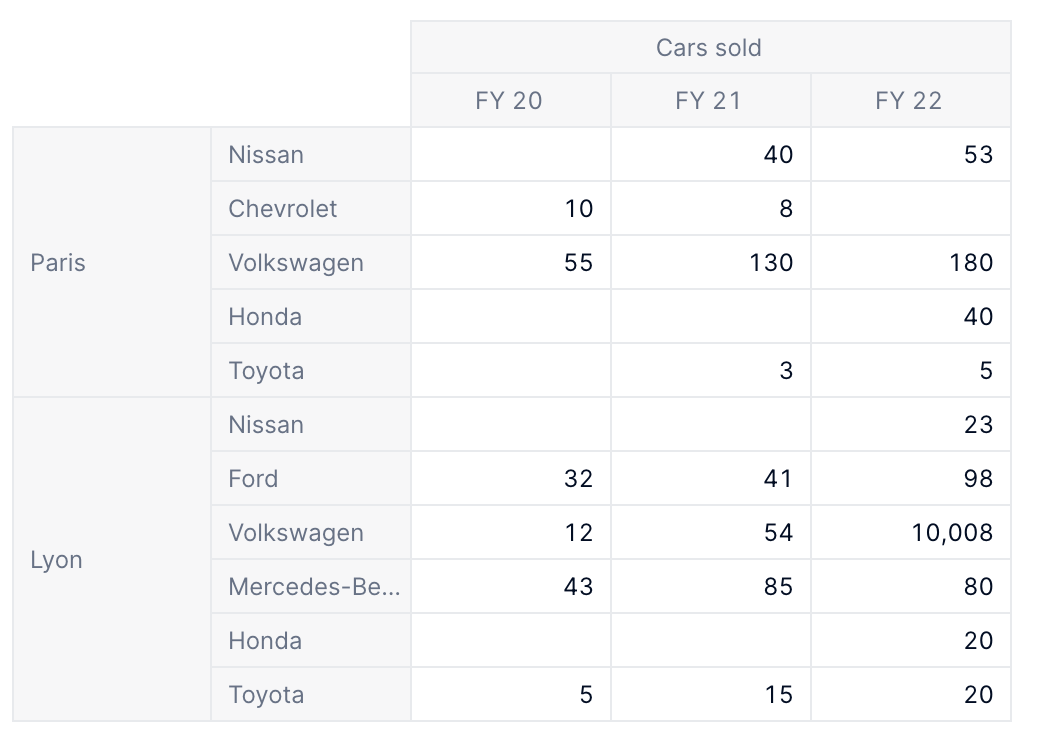
And here are the corresponding ranges:
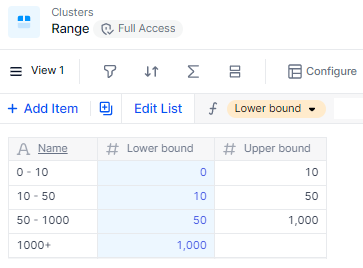
Here are some formulas to calculate the different properties, based on the Lower bound only, as an input. This makes things easier to maintain in the long run, but this is not crucial to making the overall clusters work. Using properties makes sure the Upper bound is always the next item’s lower bound and that the name correctly reflects the bounds, but you could also maintain this by hand. Only lower bounds will be used in calculations anyway.
-
Upper bound:
(Range+1).'Lower bound' -
Name:
Range.'Lower bound' & IF(ISDEFINED(Range.'Upper bound'), " - " & Range.'Upper bound', "+")
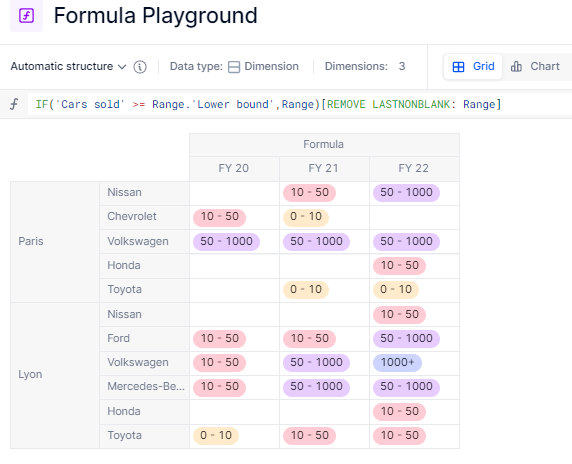
To match the values with the range, here’s the first step I can make: I’ll first have to compare the metric shown above (Cars sold) to my Range’s Lower bound.
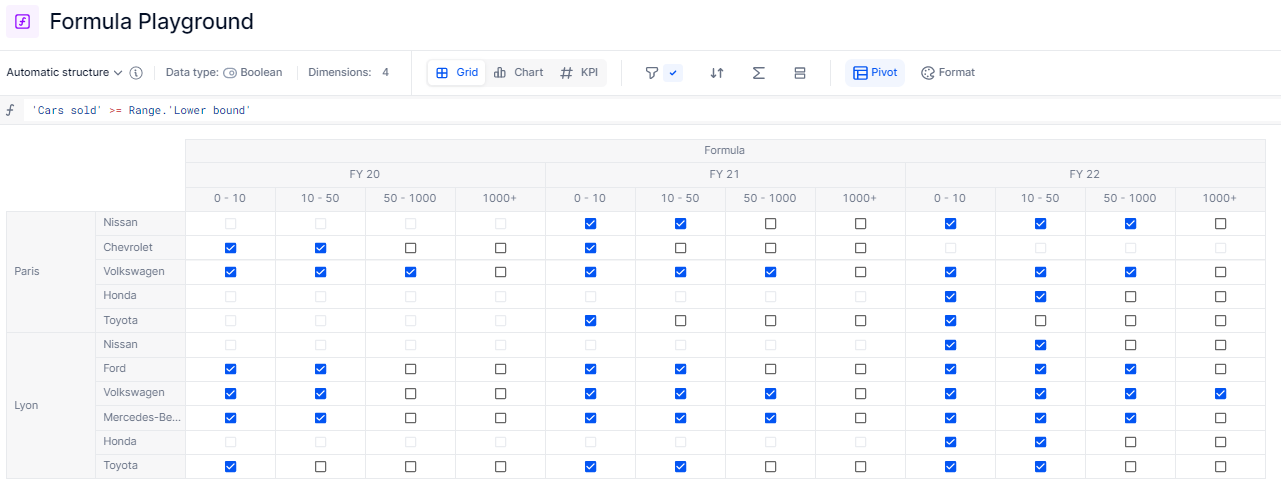
Here, Pigment is making implicit data alignment (similar to the + operation in this article). Since I’m confident with how the implicit method works, I’m going to stick with it.
With this condition, we can figure that Volkswagen’s sales in Paris in FY 20 was 55, which means it’s larger than three clusters lower bound: 0-10, 10-50 and 50-1000. The correct answer for the cluster is the last one in that list, e.g. cluster 50-1000. To get to this result, we’ll make a formula in two steps.
First, let’s turn the boolean into the cluster itself. I can do that with an IF statement.
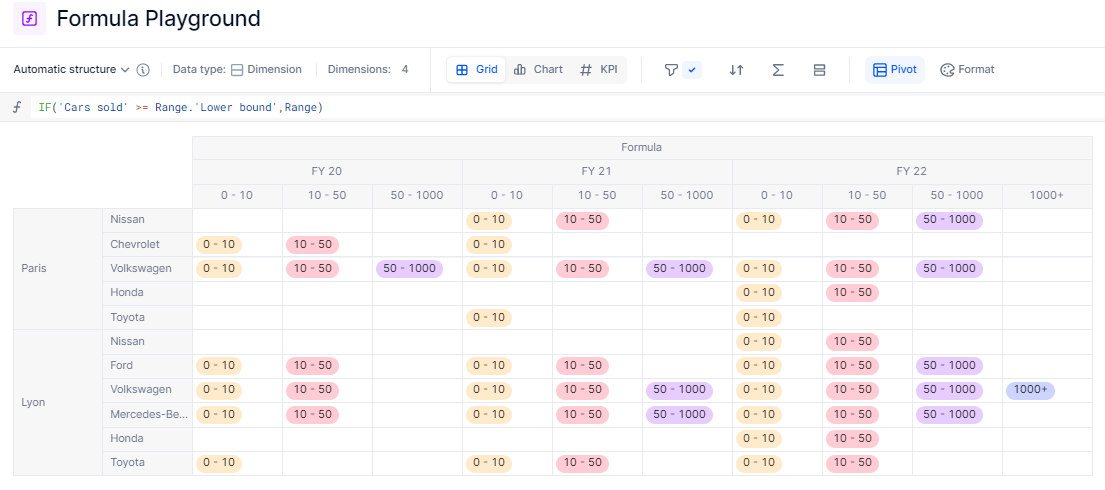
Since we only want to keep the last item that’s shown, we can append [REMOVE LASTNONBLANK: Range] to our formula. Please note that the Range dimension is not in the structure anymore.
Taking advantage of the mapping
This mapping can be used later in other metrics to count your different clusters or to plan ahead using cluster-specific assumptions you can now associate with your values.
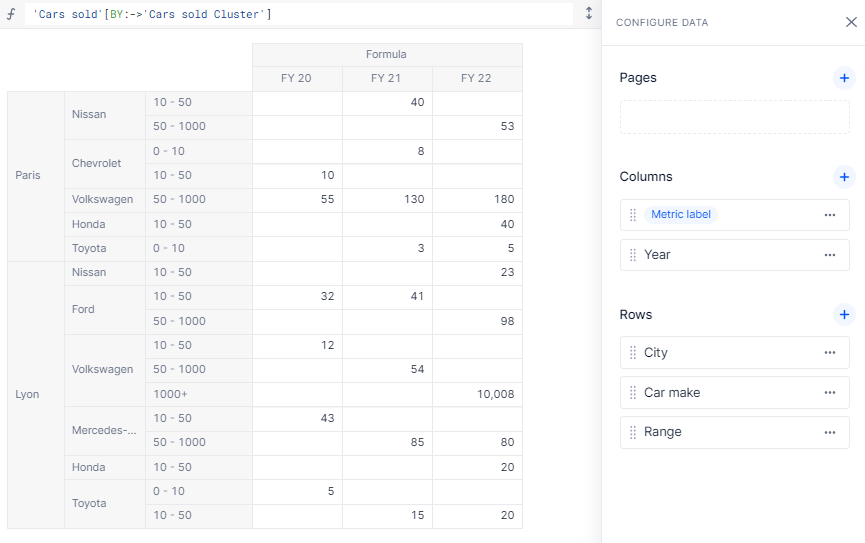
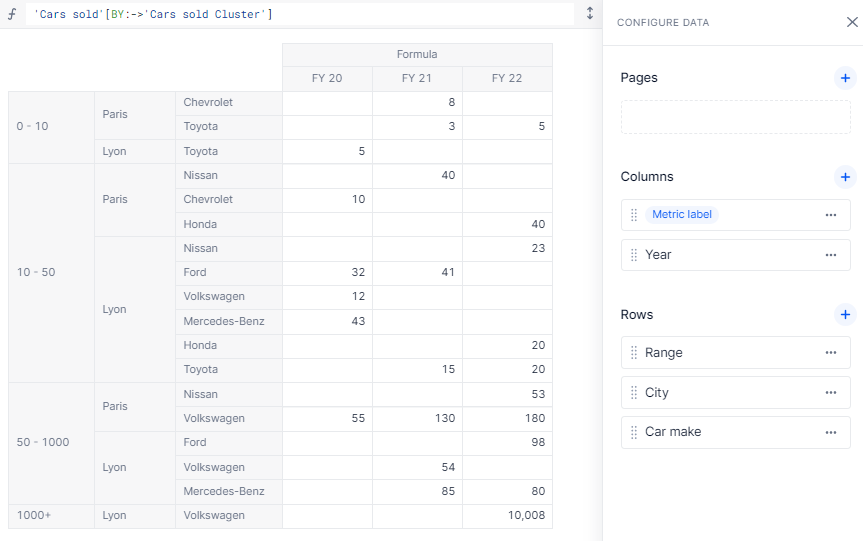
Here’s an example using a BY:->. The three different pivots give different reports on the same data.
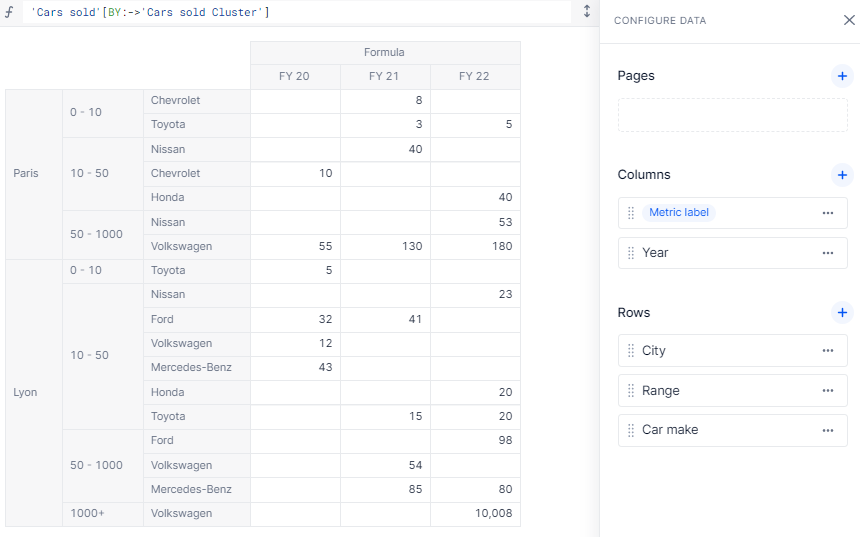
Thanks to this method, you can very easily change range bounds or even add intermediate clusters without having to monitor your formula, as it is flexible enough to change based on the items themselves.
Playing with the boundaries
In this example, you’ll note that the clusters have overlapping boundaries. In the example above, I chose to include le lower bound, and be below the upper bound (note the inclusive >= in the formula). You could change the lower bound to an exclusive one (>) or set different boundary rules (note that the lower bound 0 will be excluded).
This method works well while only working with the lower boundary because the data is strictly positive. If you were to work with either two boundaries or have open boundaries (e.g. -1000 or less for negative values and +1000 or more for positive values), you would have to work a bit differently. You could use the MINOF function to set a lower boundary in the case of a blank value, and change your formula to this:
IF('Cars sold' >= IFBLANK(Range.'Lower bound', MINOF('Cars sold')), Range)[REMOVE LASTNONBLANK: Range]
Is there something I missed? Are you stuck on a cluster problem? Let me know if you have any questions on the topic!


