Hello Pigment Community!
I hope this post finds you well. I'm currently working on enhancing my model's performance by calculating an adjusted average by month for deal completion times. While I've successfully calculated the average number of days for deal completion in a straightforward manner, I'm now facing challenges taking it to the next level. I'm reaching out to this community for assistance, and I would greatly appreciate your input and expertise.
Current Solution:
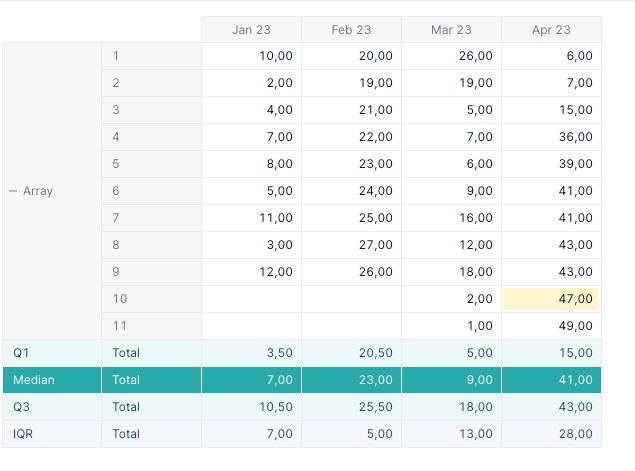
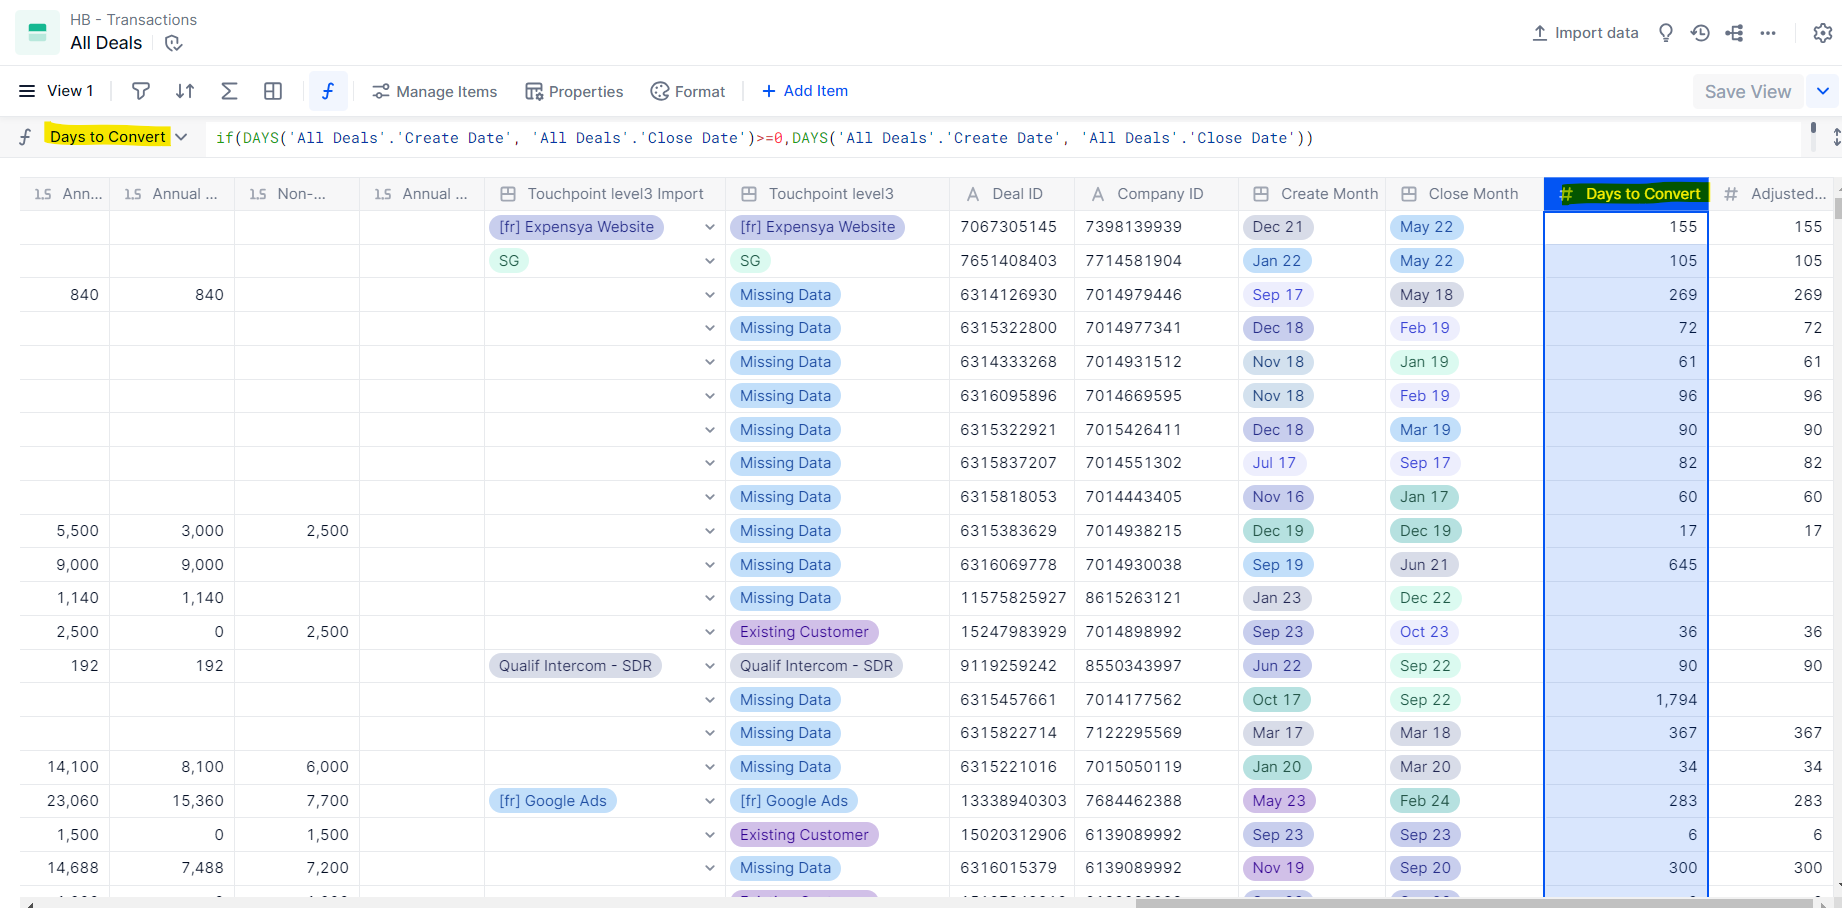
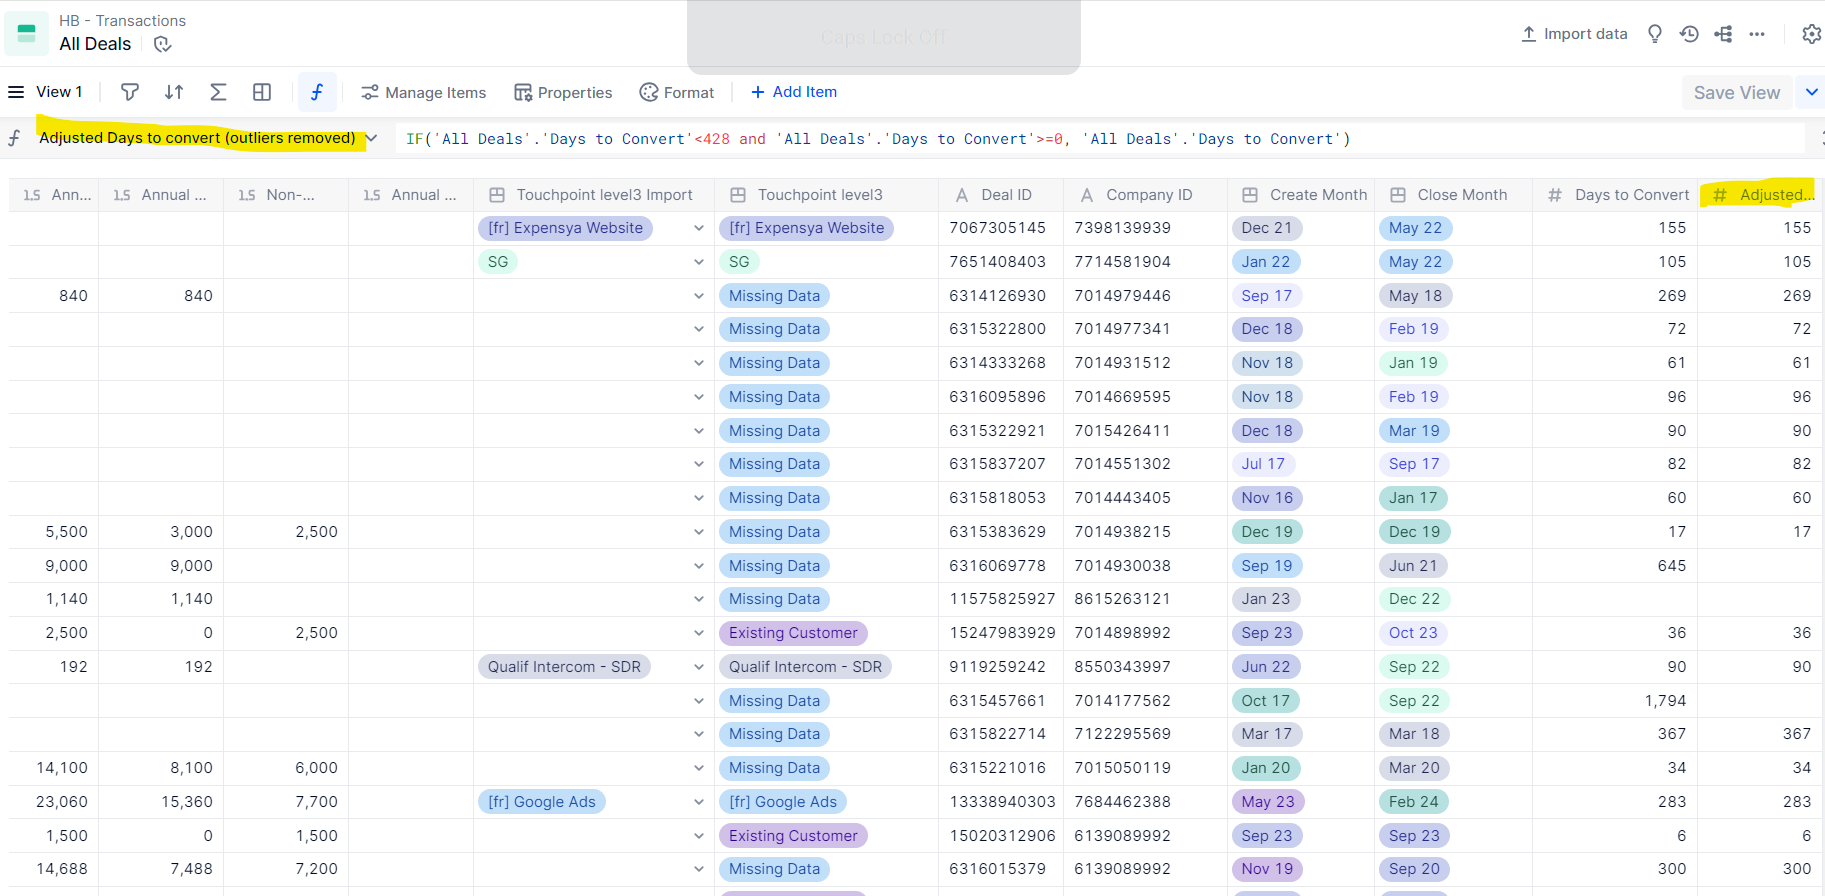
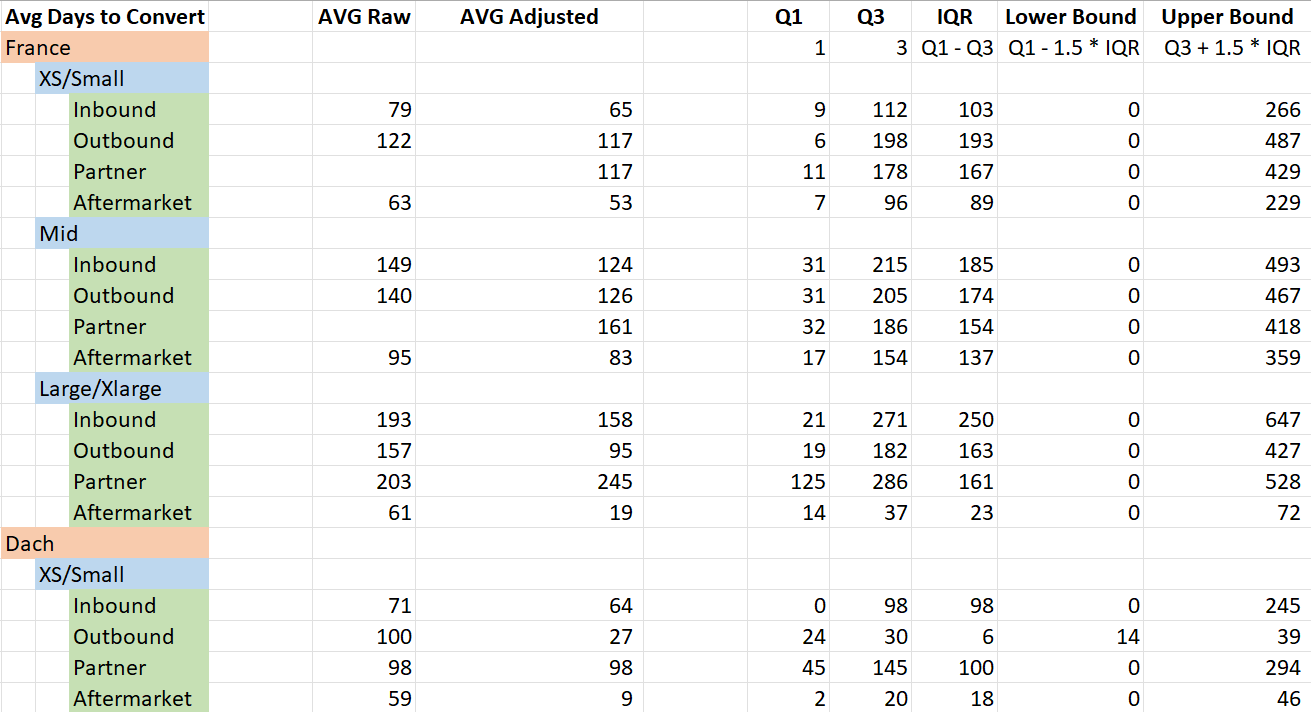
In my current approach, I utilize a transaction block named "All Deals," containing two columns - 'create date' and 'close date.' Using the 'DAYS' pigment function, I calculate the difference between these two dates. Then, using Excel I compute the 1st and 3rd quartiles using the excel function “QUARTILE.INC”. I then calculate the the Inter-quartile range (IQR), which I use to calculate the upper and lower bounds for my data. I then manually input the upper and lower bounds in my pigment solution to exclude outliers and ensure more accurate averages. However, this method has its drawbacks, including the need for manual updates if the average value changes and a lack of specificity as I aim to calculate adjusted averages based on different dimensions, specifically country, segment, and touchpoint.
Challenges with Current Solution:
1. Manual updates required for changes in the average value.
2. Lack of specificity in calculating adjusted averages based on various fields.
3. Dependency on Excel for quartile calculations.
Ideal Solution:
In an ideal scenario, I envision the following steps:
1. Find the 1st quartile (Q1) and 3rd quartile (Q3) of the data.
- Note: While Excel has the QUARTILE.INC function, Pigment lacks a similar function, and I'm seeking guidance on achieving this in Pigment.
2. Calculate the IQR (Inter-quartile range): IQR = Q3 - Q1.
3. Determine lower and upper bounds to identify and exclude outliers.
- Lower bound: Q1 - 1.5 * IQR
- Upper bound: Q3 + 1.5 * IQR
4. Use the upper and lower bounds to exclude outlier data points, allowing for the calculation of adjusted averages based on the dimensions country, segment, touchpoint.
5. Achieve a metric showcasing adjusted averages by month, dimensioned on country, segment, and touchpoint.
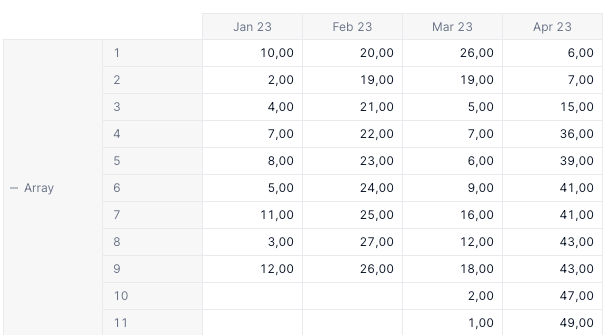
Below I have attached a screenshot taken from excel, however I imagine the final metric would be similar to that of ‘AVG Adjusted’.
Seeking Community Assistance:
I'm reaching out to the Pigment community for help in implementing the ideal solution. If you have insights, suggestions, or alternative approaches within Pigment that could streamline this process, please share your expertise.
Thank you in advance for your valuable input!
Best answer by Issam Moalla
View original