Hi Pigment Community,
I am trying to create a KPI that tracks the ratio of blank cells to filled cells for a column in a transaction list. In addition I want this KPI to be dimensioned so that it can be affected by the page filters, however I can’t seem to figure out a solution and was wondering if any of you had a solution for me.
So far I have attempted 4 different solutions, however none of them have given me exactly what I am looking for.
Below I have provided screenshots of the different parts that contribute to my problem. As I have tried different solutions and none of them have worked I have provided information for each formula, as I don’t understand why each one gives me a different output. My end goal is to have the proper ratio of (all blanks) / (all blank + nonblank) which can be filtered by dimensions using the page option. Specifically: year, deal status, and HB - Deal Owner.
Extra info:
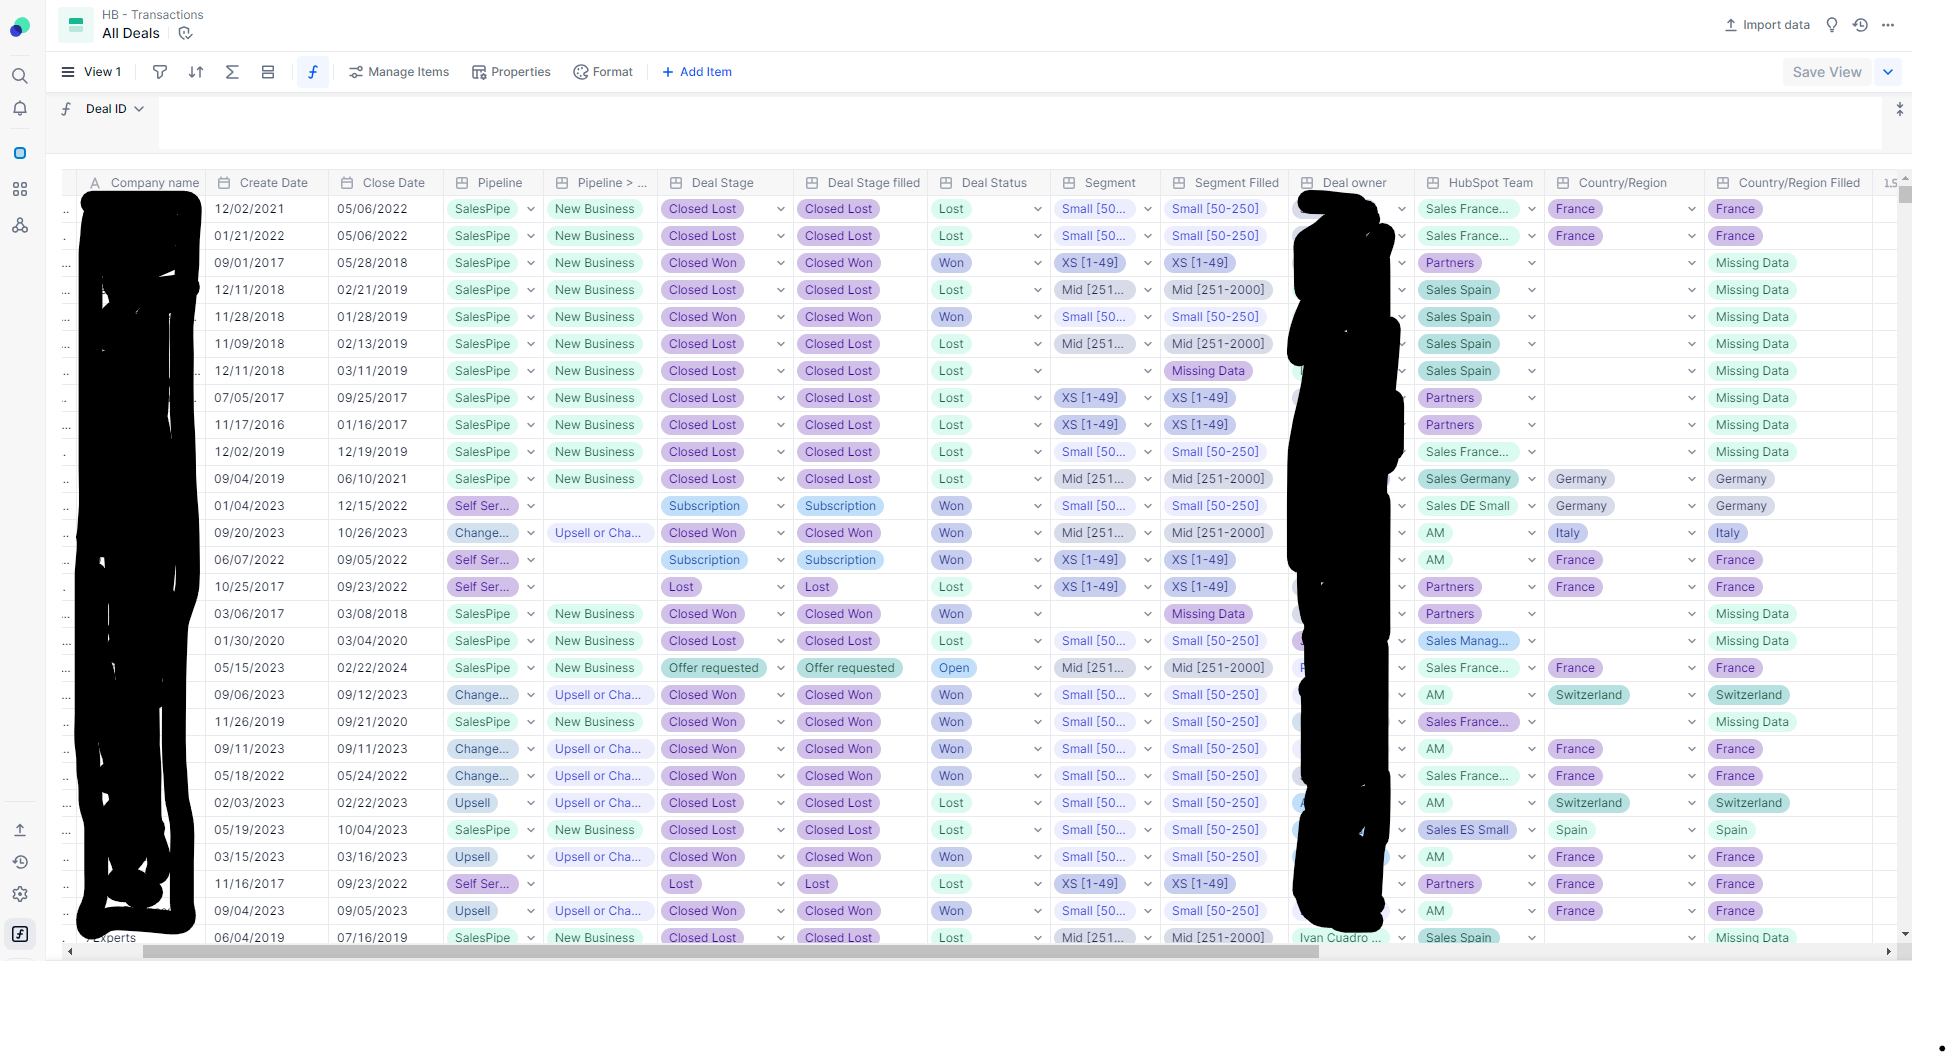
All deals - total row count = 5,504
All deals.segment = blank = 292
Ratio = 292 / 5504 * 100 = 5% (rounded)
Formula’s for KPIs
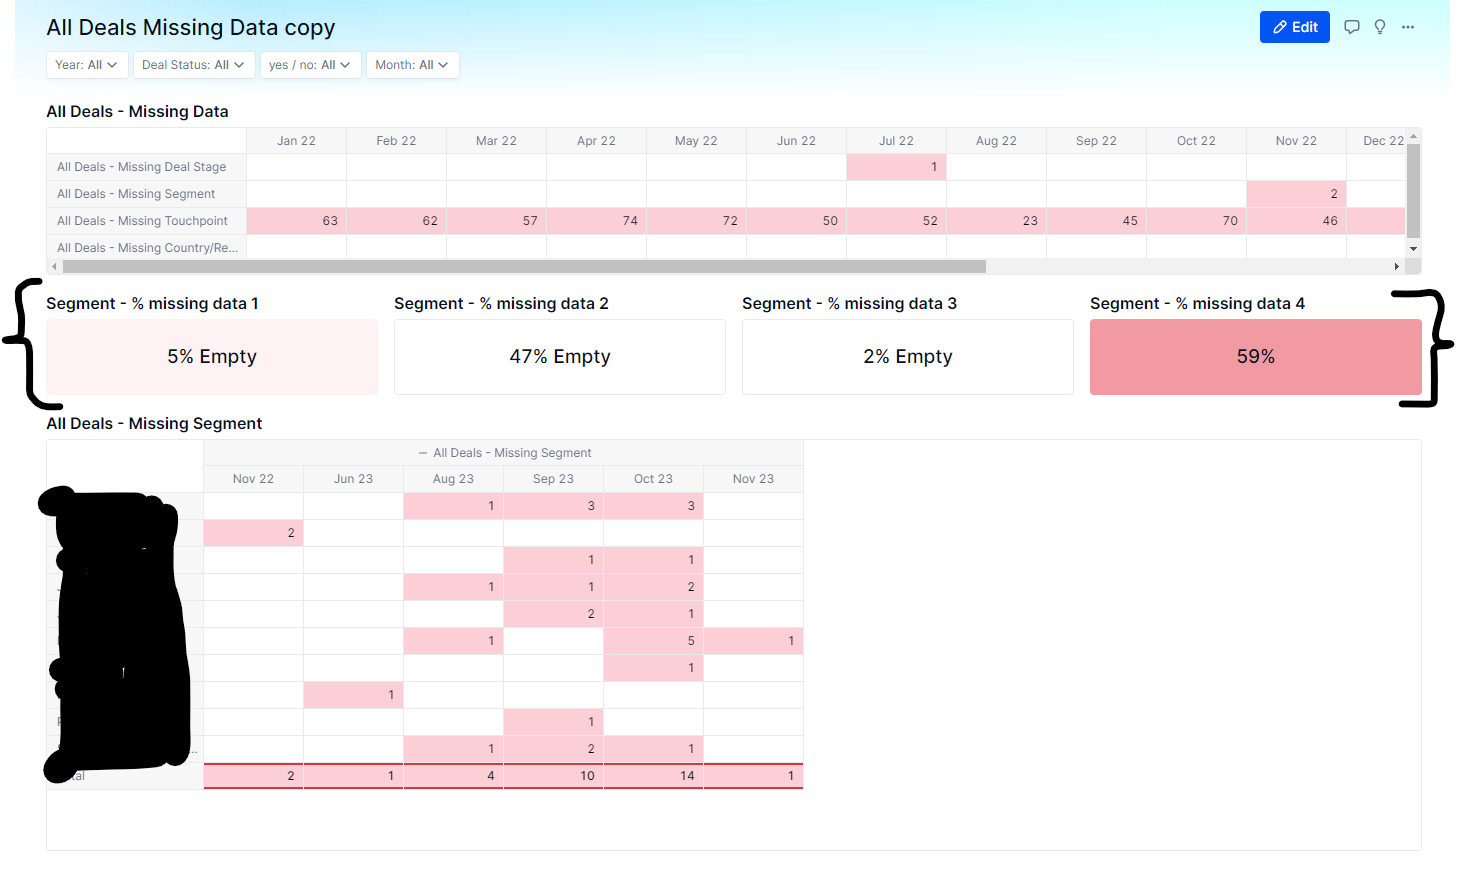
Segment - % missing data
This formula is correct, however the dimensions are removed. Thus, I can’t filter on dimensions, so my kpi is static. Also, when I try to add them back it doesn’t seem to work. Perhaps I don’t understand how the dimensions can be readded?
COUNTBLANKOF('All Deals'.Segment)/COUNTALLOF('All Deals'.Segment)Segment - % missing data 2
In this formula I tried to take the count of my segment and apply a filter to then divide it by my count when I don’t have a filter applied. From my understanding this should find all my blank values and then divide by all my total values. However, the outcome is not what I expected.
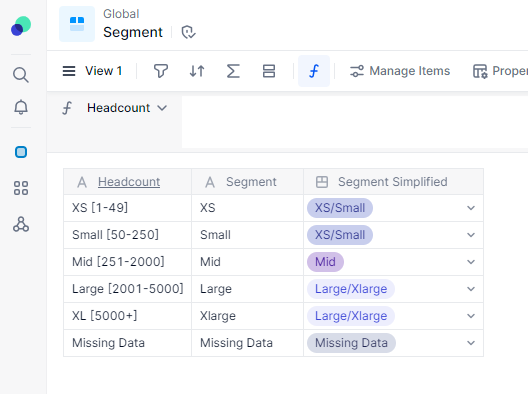
NOTE: ‘segment filled’ is an additional column I made so that I could dimension blank cells in segment as ‘missing data’.
('All Deals'.'Segment Filled'[filter: 'All Deals'.'Segment Filled'.'Segment Simplified' = 'Segment Simplified'."Missing Data"][by count: 'All Deals'.'Create Month', 'All Deals'.'Deal owner', 'All Deals'.'Deal Status'])/('All Deals'.'Segment Filled'[by count: 'All Deals'.'Create Month', 'All Deals'.'Deal owner', 'All Deals'.'Deal Status'])Segment - % missing data 3
In this formula I tried to take the count of blanks for segment dimensioned by create month, deal owner, and deal status and then divide by the total count. Again this did not work as I expected.
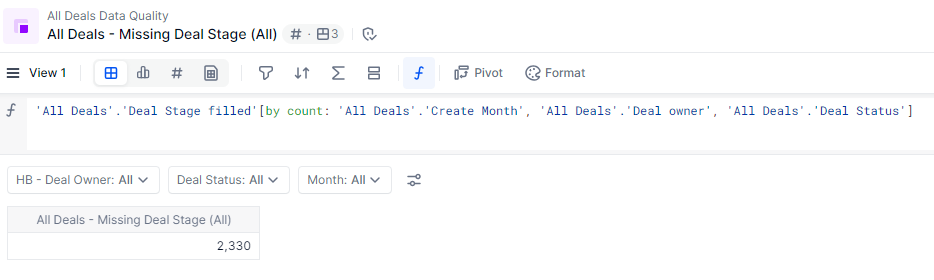
'All Deals'.Segment[by countblank: 'All Deals'.'Create Month', 'All Deals'.'Deal owner', 'All Deals'.'Deal Status']/'All Deals'.Segment[by count: 'All Deals'.'Create Month', 'All Deals'.'Deal owner', 'All Deals'.'Deal Status']Segment - % missing data 4
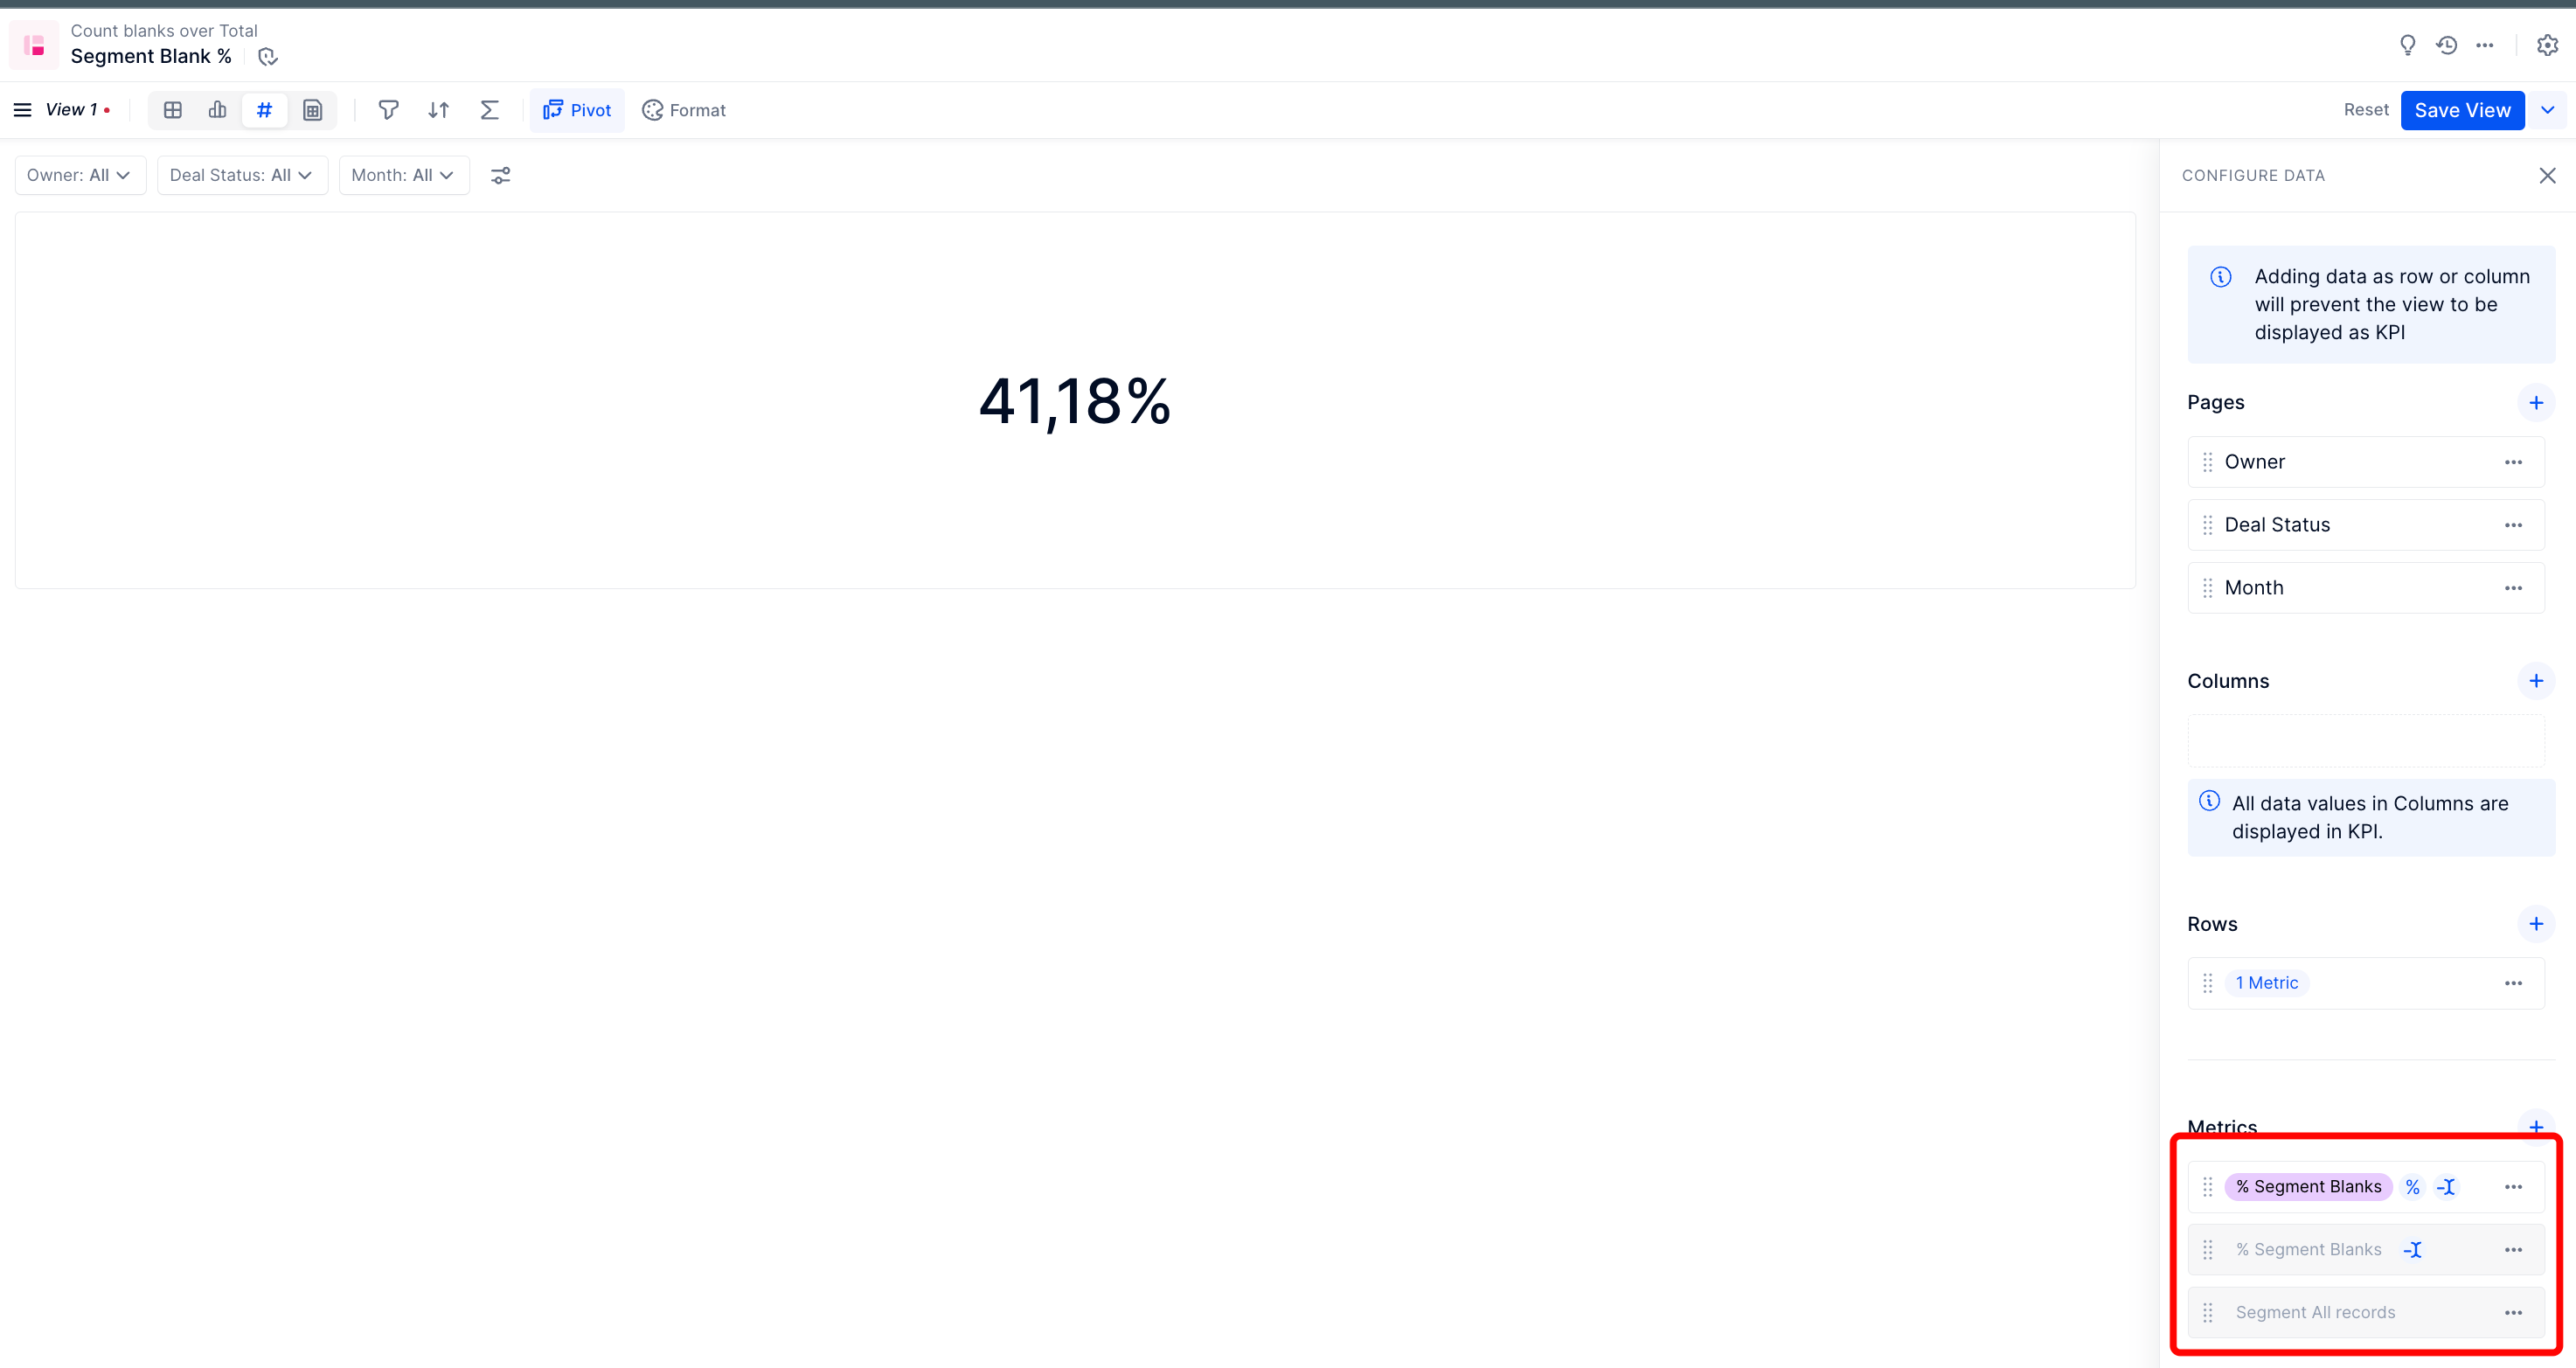
My last attempt. Here I created two metrics and then tried to divide them by one another. My hope was that I could have the dimension in the metric, and when I divided them by one another the dimensions would stay and then I could put them in the page selector to filter by on the view. Unfortuantely, this did not work either. This did bring me the closest to my solution though, however by looking at the metric results you can see that the calculated values are smaller than what is present in the ‘All Deals’ transaction list.
'All Deals - Missing Deal Stage (blanks)'/'All Deals - Missing Deal Stage (All)'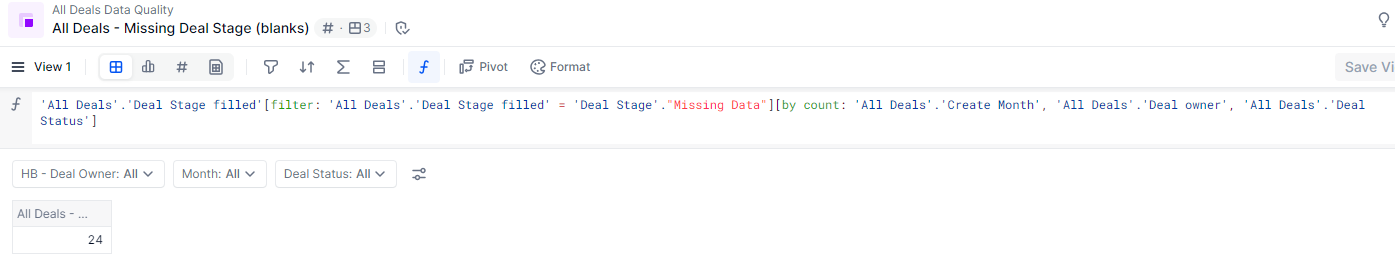
I would really appreciate any help and understanding you could to provide to me. Thank you in advance, and apologies for the long post.
Thank you!
Best answer by Issam Moalla
View original