Solved

Creating quarter-end / year-end summaries of cumulative metrics

  • 28 February 2024
  • 2 replies
  • 107 views

Badge

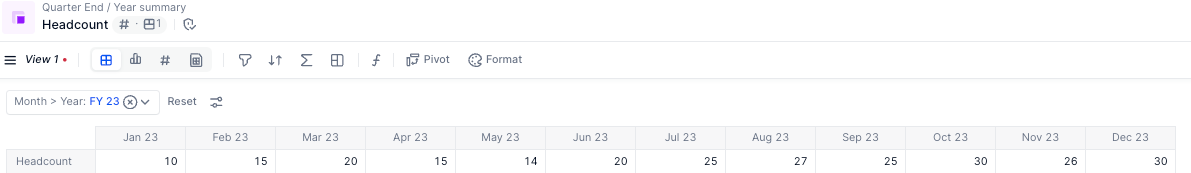
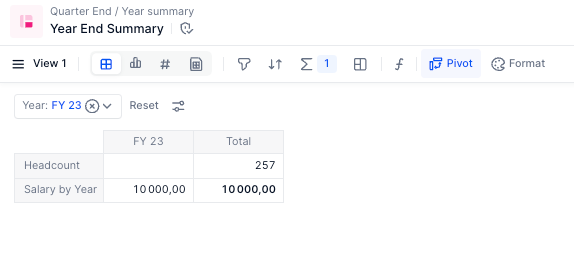
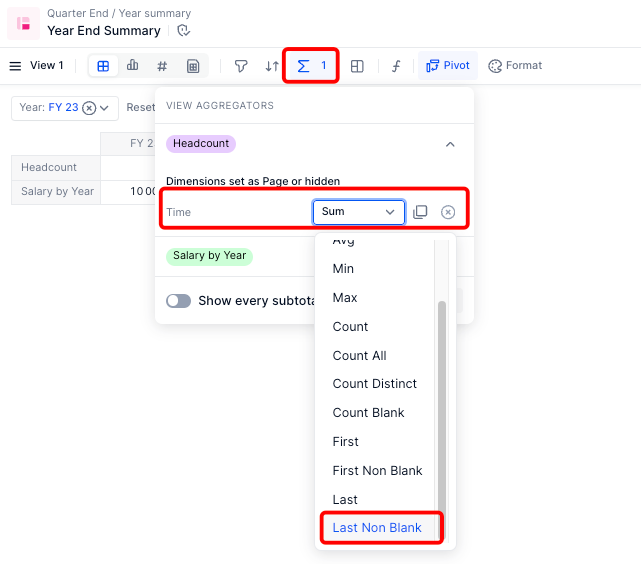
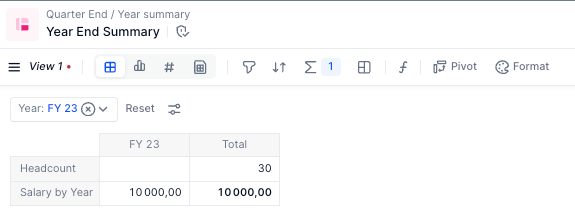
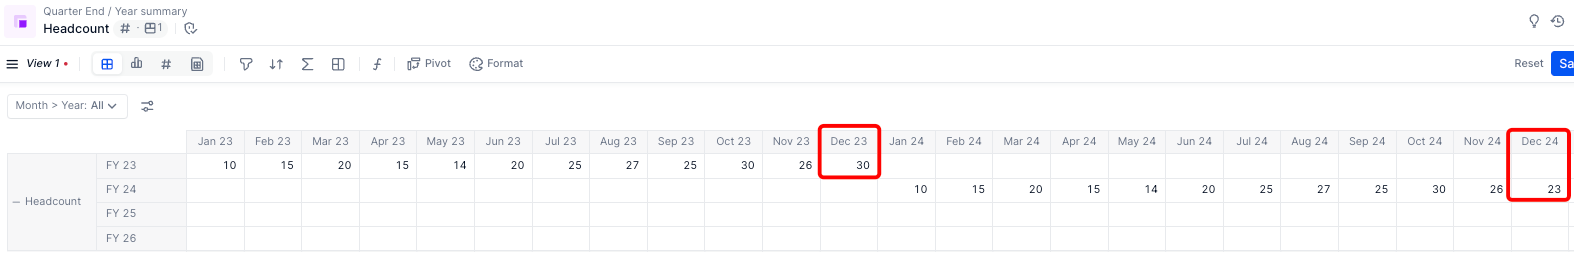
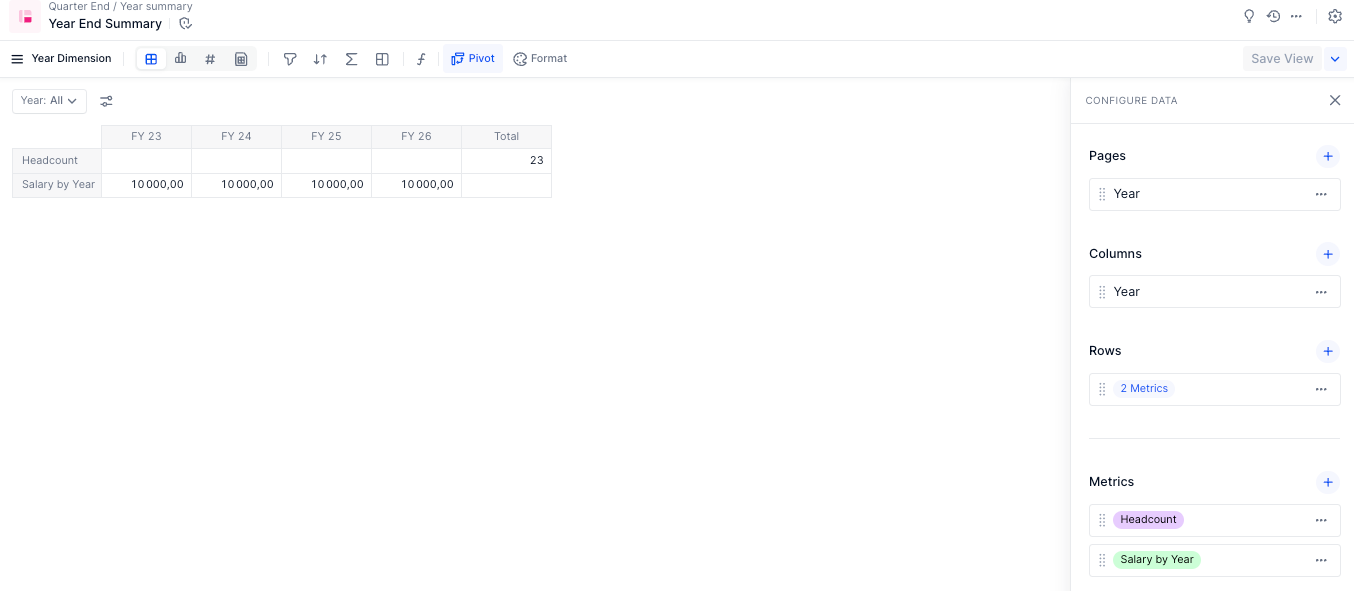
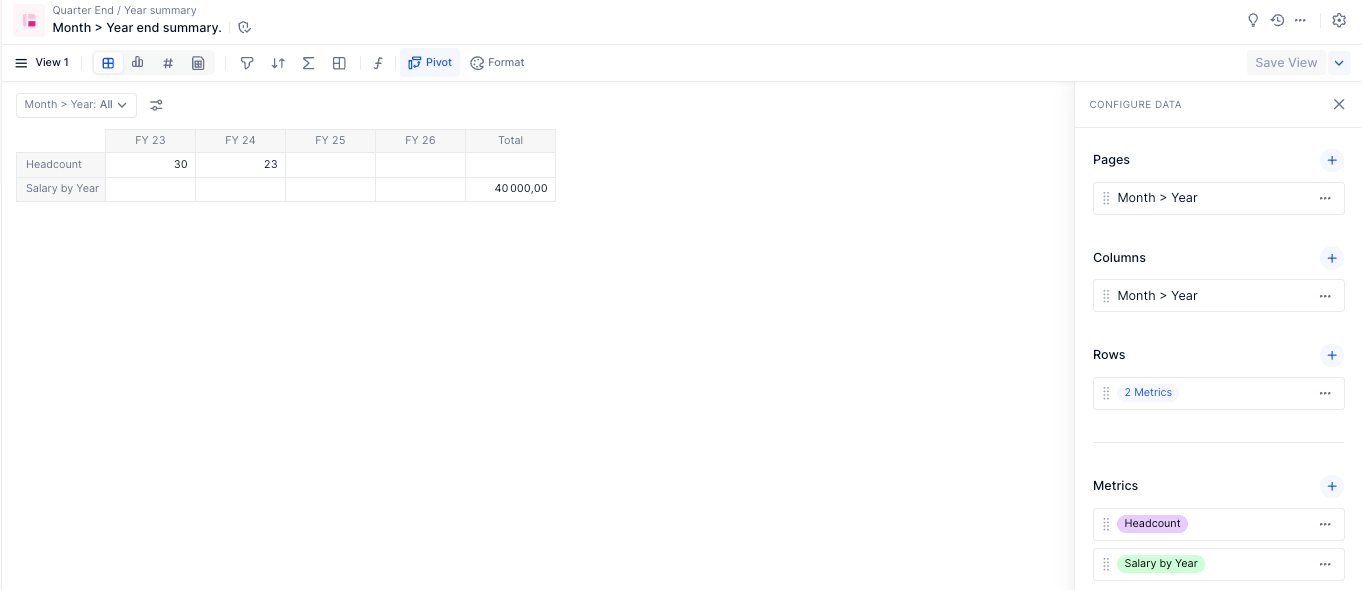
Hi, I’m trying to add a view of a monthly total headcount metric (a cumulative value, dimensioned by month) to quarterly and annual tables that will show only the final headcount from the last month of each period. For example, I know Pigment’s default behavior is to sum this cumulative headcount across every month of a year if I add the headcount metric to an annual table directly, but I need to isolate December 31 headcount only. Is there a relatively simple way to create these period-end summary numbers?

Thanks!

icon

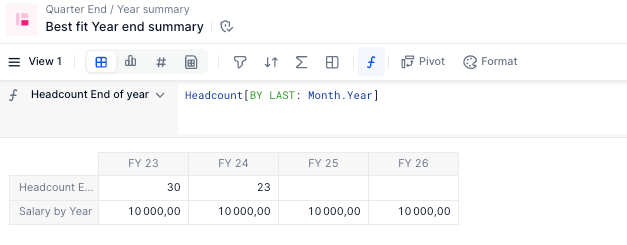
Best answer by Issam Moalla 29 February 2024, 12:57

View original

2 replies

Userlevel 5
Badge +9

Hi @justinspielman ,

I have tried to reproduce what you trying to achieve as follows:

  • A headcount metric dimensioned by Month
  • A Salary by Year metric
  • Created a table having the Salary by Year metric as an annual table and then I added the Headcount metric:

    As the screenshot shows the headcount total would be the sum of all the months of the year.

  • To get the end of year summary which corresponds to Dec value, you would need to adjust the VIEW AGGREGATORS for the Headcount metric on Time to the Last Non Blank:


Hope this answers your question.
Issam

Userlevel 5
Badge +9

Hi @justinspielman ,

I have noticed couple of issues with my approach. It works great when I filter on specific year bu on all years the result is not correct.
I have added values for the FY24 in the Headcount metric:
 

If I keep the year dimension I would get the last non blank value which is Dec 24: 
 

The result must be different from one year to another.
Another option is to replace the year dimension in my table with the Month> Year property, the result would be correct for each year as I get the Dec 23 and Dec 24 values but the salary would be aggregated not by year:


So I would suggest as a best fit is to create the Headcount metric by the granularity you wish to have in my case the year and use the BY modifier to get the result at year level:

Headcount[BY LAST: Month.Year]

Here I adjusted the formula to use the LAST aggregator, this option will get me the value for Dec which is the last value for each year:
 

By adding this new metric to my table dimensioned by Year, the result would be correct for each year:
 

Hope this provides more clarifications.
Issam
 

Reply