

Hi Pigment Community,
I am reaching out to bring attention to an issue I've been encountering with Pigment, particularly in relation to the mathematical output it provides. While Pigment generally performs as expected, I have noticed instances where the results are unexpectedly incorrect.
To provide clarity, I have attached screenshots displaying the metrics and their corresponding outcomes. I've highlighted the specific instances where Pigment has generated results that deviate from the anticipated values. It's worth noting that there are occurrences where the formula yields accurate results, but the inconsistency raises concerns about best practices and how formulas work.
My hope is that you can help me understand the root cause of this issue and provide insights to correct this issue. I appreciate any assistance you can provide in shedding light on why Pigment might be producing these unexpected results. Additionally, I am keen to learn any best practices or recommendations to avoid similar discrepancies in the future.
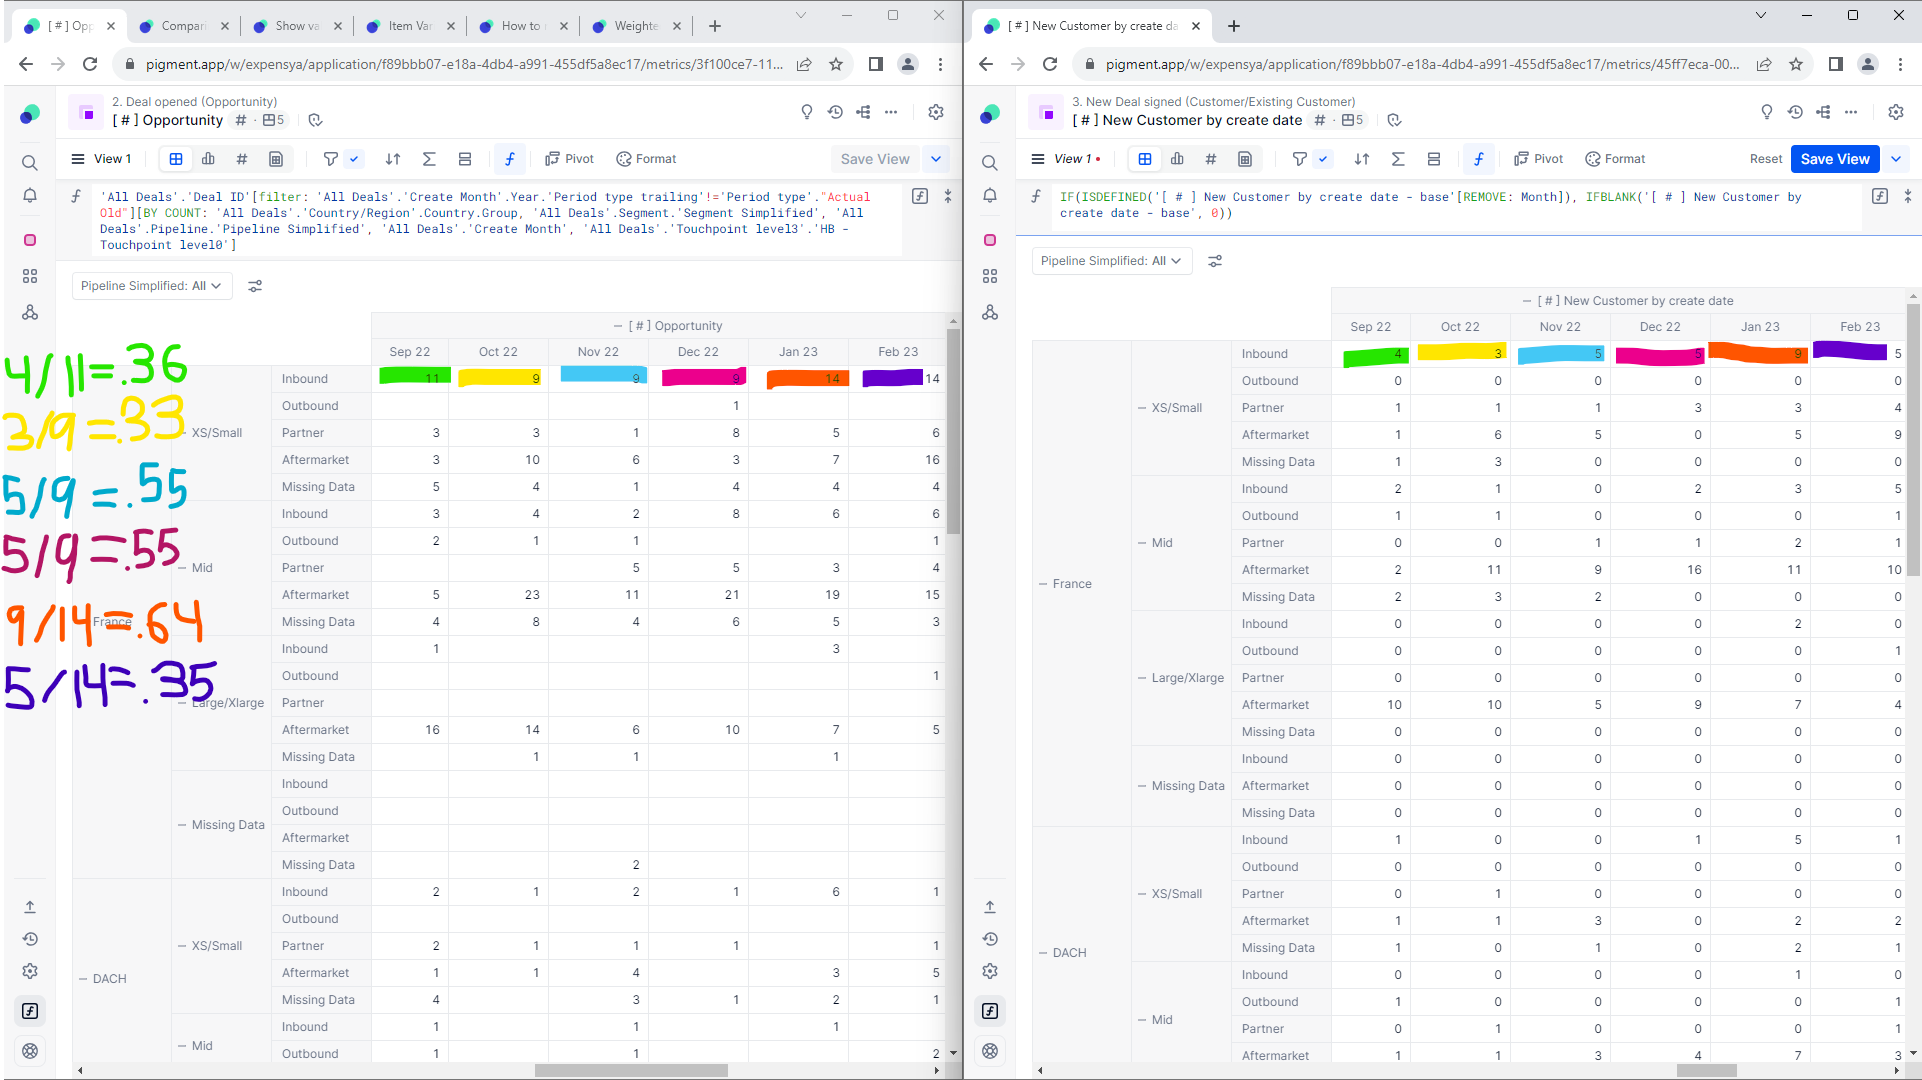
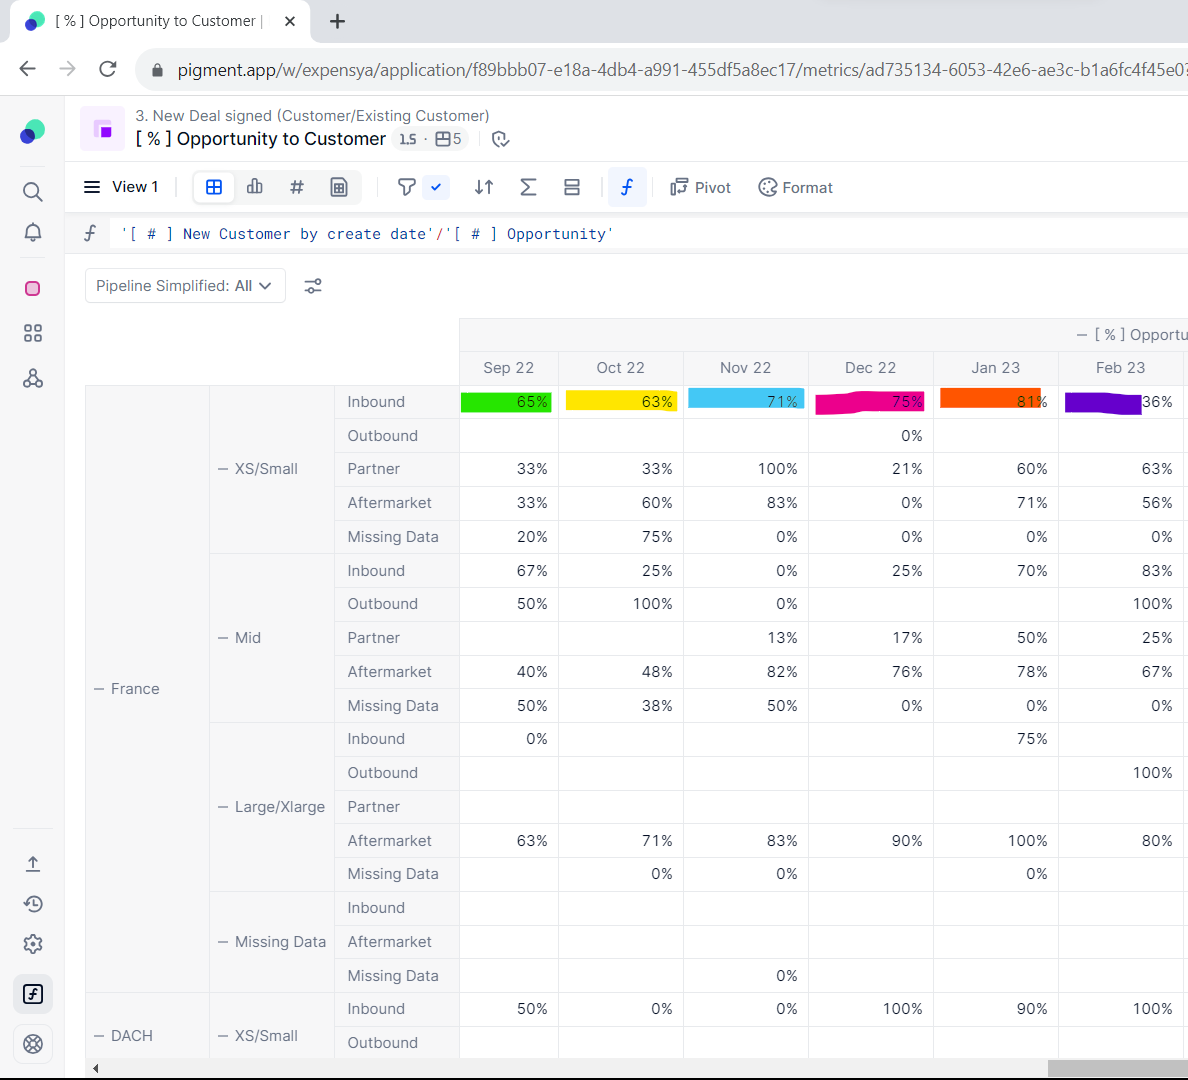
By looking at the image above it can be seen that out of all the highlighted values only purple is correct, the rest are not close at all to being correct. What’s even more interesting is that when looking at Nov 22 and Dec 22 they both have opportunities of (9) and customers of (5), but in the end they have different percentages. How can this even be possible?
Extra Info
- The metrics are built using a transaction block called ‘All Deals’
- The dimensions in the formula are called using the ‘by’ aggregator. Additionally all rows of these dimensions are fully filled, that is to say they have no blank rows.
- When I drill down to see the data in ‘% opp to customer’ I see the same values displayed in the first screenshot with the count of opportunities and customers.
- the ‘Actual old’ filter is used to ensure the calculation only takes place on data according to our switchover date, which is based on our max date in ‘All transactions’
- IF(ISDEFINED('[ # ] New Customer by create date - base'[REMOVE: Month]), IFBLANK('[ # ] New Customer by create date - base', 0)) → this formula is used for ‘new customer by create date’ to counter pigments sparse model. This makes the formula accurate, because without this if there was an opportunity that yielded 0 customers pigment would consider the percent as blank instead of 0% so my formula ensure that my % calculation will have 0% rather than just blanks.
I’d love to understand why this is happening, so if you require any further information to better understand the situation please let me know!
I appreciate all the help and guidance you can provide.
Thank you!
-Darious
Best answer by Issam Moalla
View original


