Hi Pigment Community!
I hope this message finds you well. I am currently working on building a table that will display my Year-over-Year(YoY) Moving Average(MA) of opportunities to customers. The ultimate goal is to use these calculations to create a growth hypothesis, which will then be employed for forecasting future opportunities and customers. I want to ensure that my YoY MA calculations are not only viewable at all levels of granularity but also correctly calculated for both granular and total values. I'm facing two main challenges that I'm seeking assistance with.
Problem 1: Granular and Total Value Calculation I want to create a calculation that accurately computes both granular and total values without the aggregation issues I'm currently experiencing.
Problem 2: Referencing YoY MA Values for Future Growth Hypothesis I aim to reference YoY MA values in future metrics for the growth hypothesis without being hindered by the limitations of calculated items and 'show value as' functions.
Once I calculate my YoY MA values I want to use them to populate a growth hypothesis, which will be used to calculate a forecast for future opportunities and customers, I mention this because I want to be able to reference my YoY MA calculations so that they can be used in future metrics when I build my forecast. In addition to being able to reference my values I also want to have the actual calculations at all levels of granularity. Meaning that I want to avoid Pigment from aggregating the most granular values to provide the totals. I am aware that I could calculate 1 metric per level of granularity, however I want to avoid this because it is not scalable.
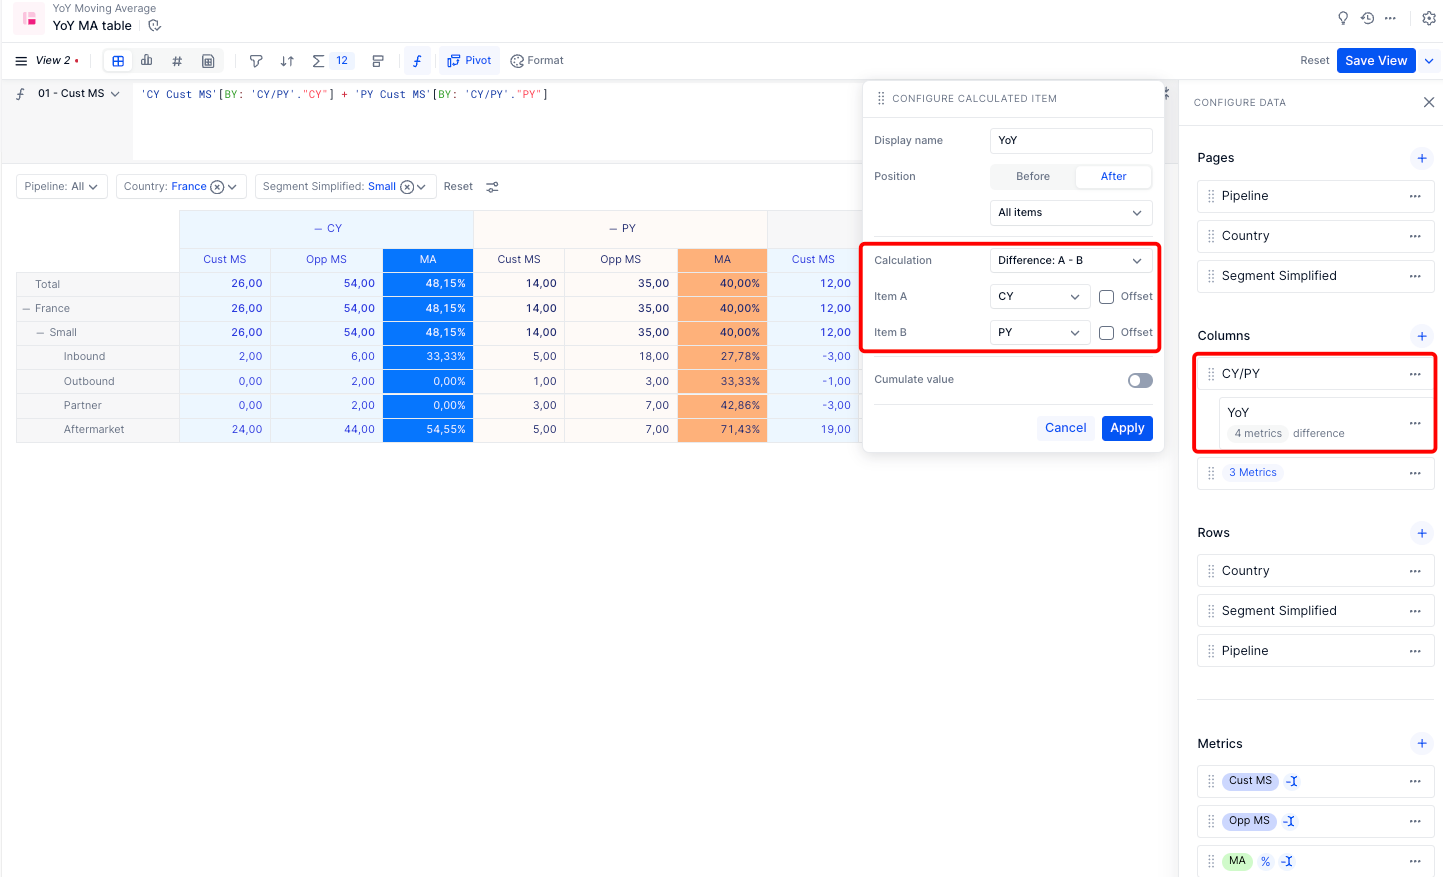
Initially, I attempted to use a table, but I realized that calculated items and 'show value as' cannot be referenced, limiting the table's functionality for forecasting. Additionally, I encountered issues with using 'show value as' on a 'show value as,' preventing me from achieving the desired outcome.
Additionally, I created a metric which has the correct values at the most granular level but provides an aggregation for totals, rather than the actual calculation. The ideal solution would be to build a metric that can be referenced and has the actual calculated values at the total level, however I currently think the best solution would be to have a metric for my hypothesis and a table to visualize my hypothesis.
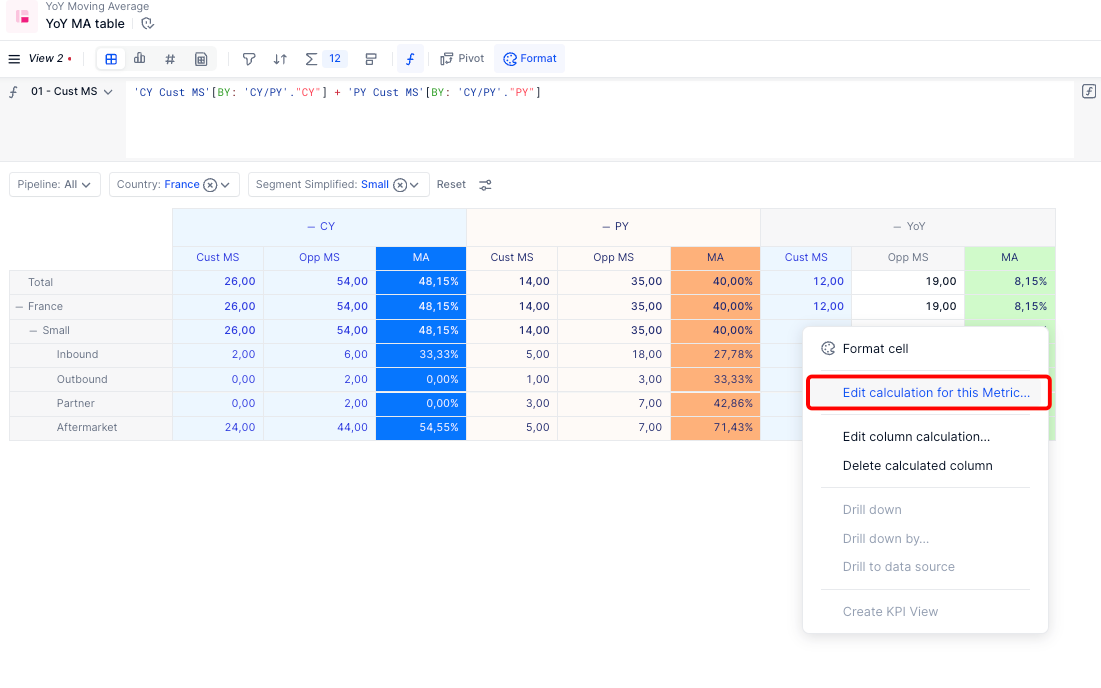
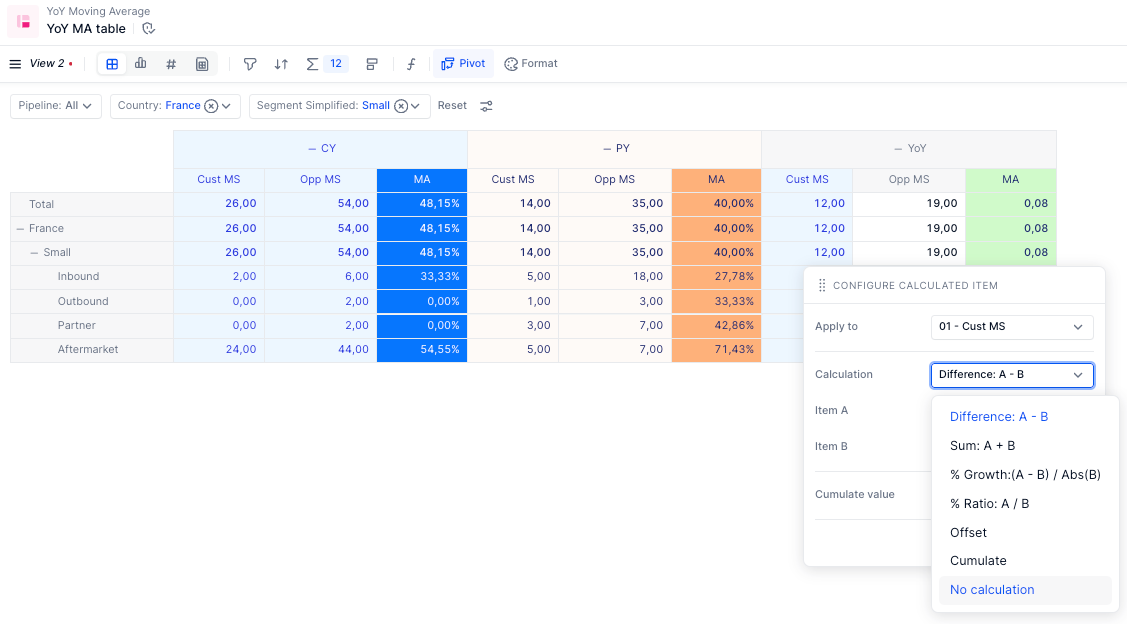
Screenshots of my model and more info below
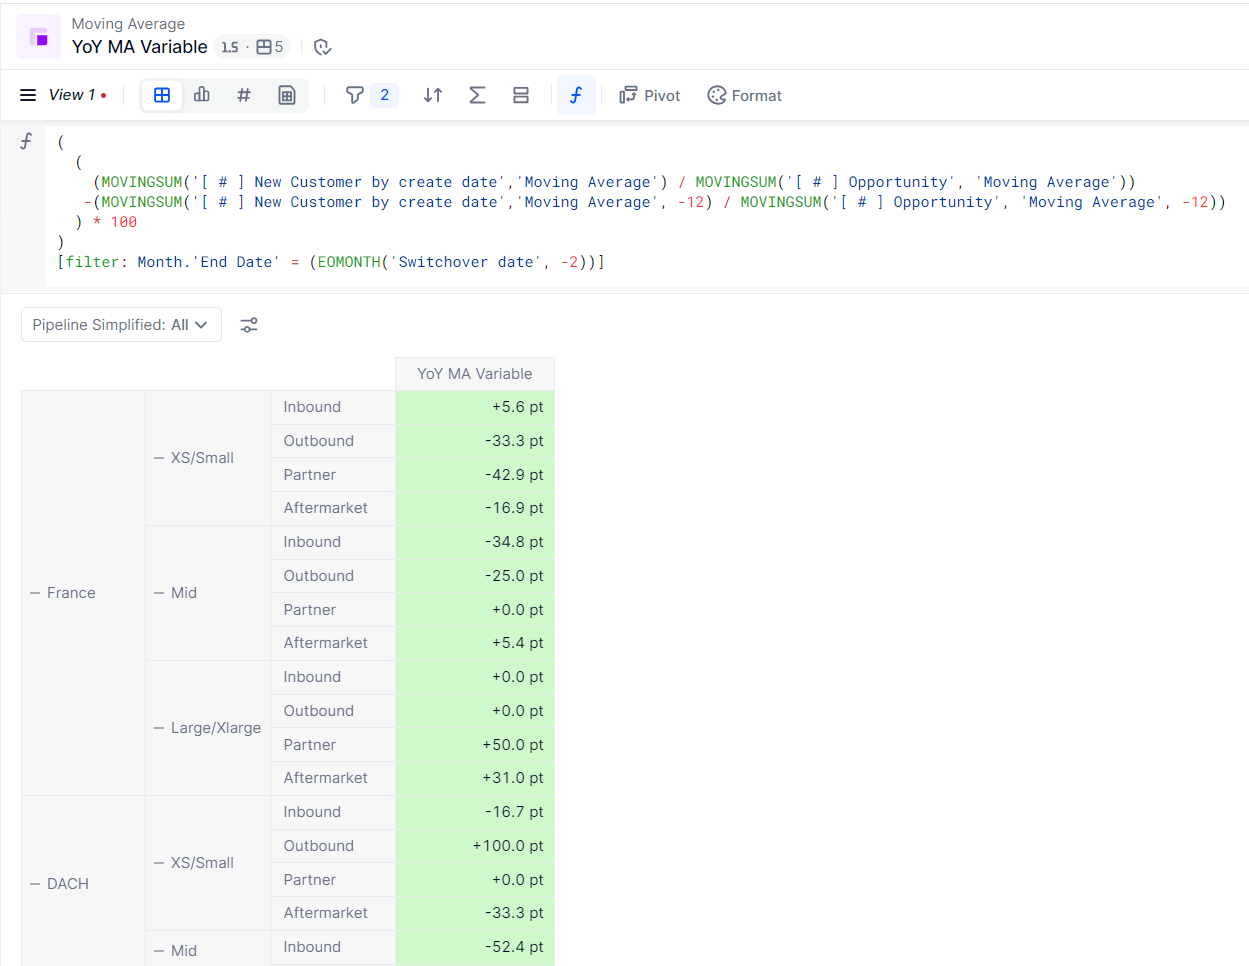
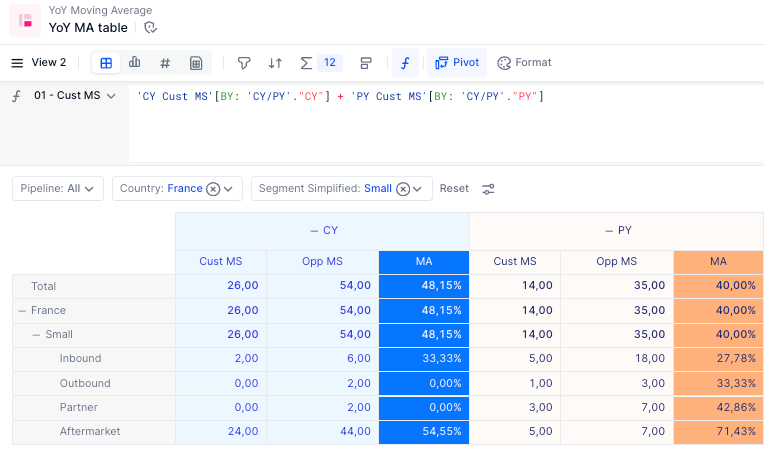
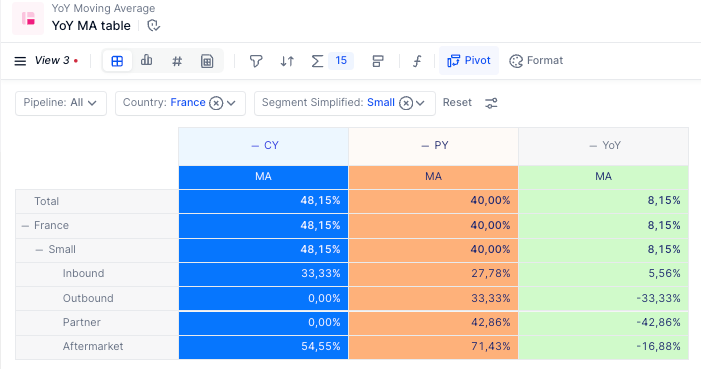
With this metric I have the values at the granular level, however I only have aggregations at the total level. I expect that these values could be used for my growth hypothesis, however if I looked at total values pigment would aggregate and provide me with an outcome different to what I am looking for. How can I adjust this metric to have the calculated values at all levels of granularity, while still being able to reference it in the future?
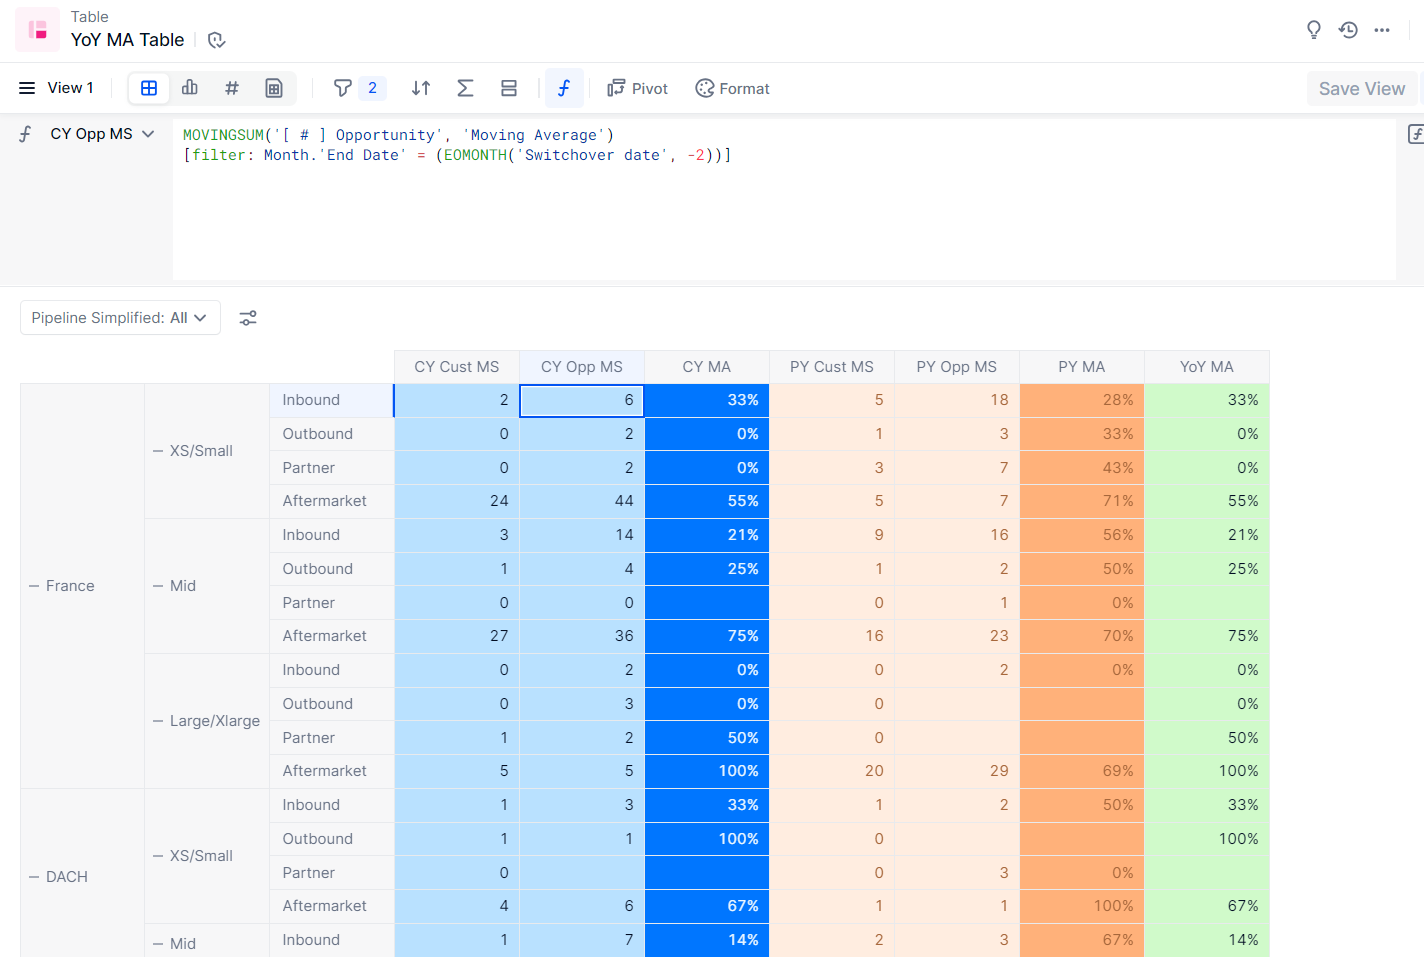
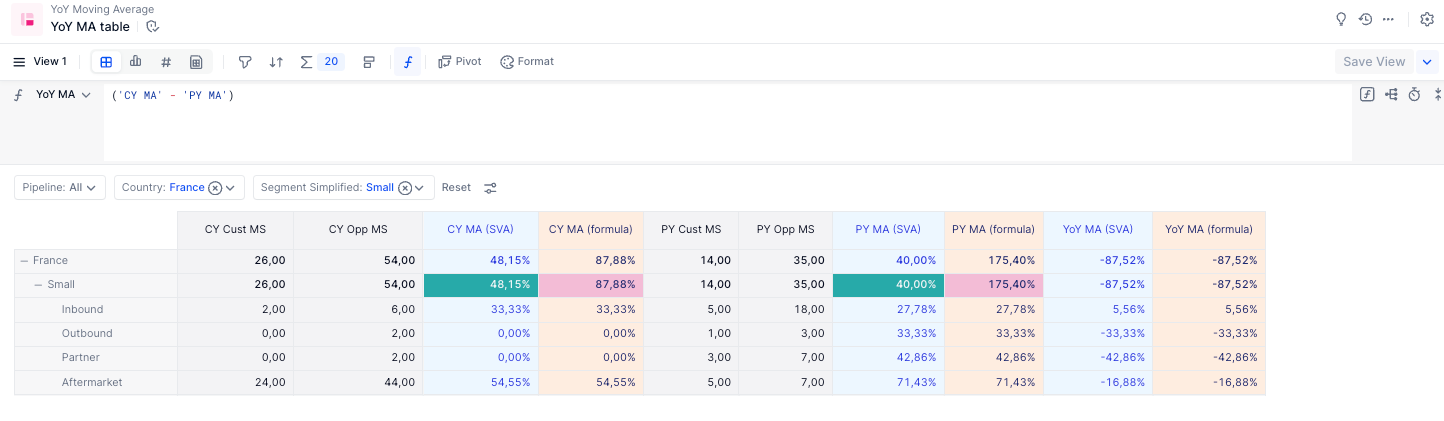
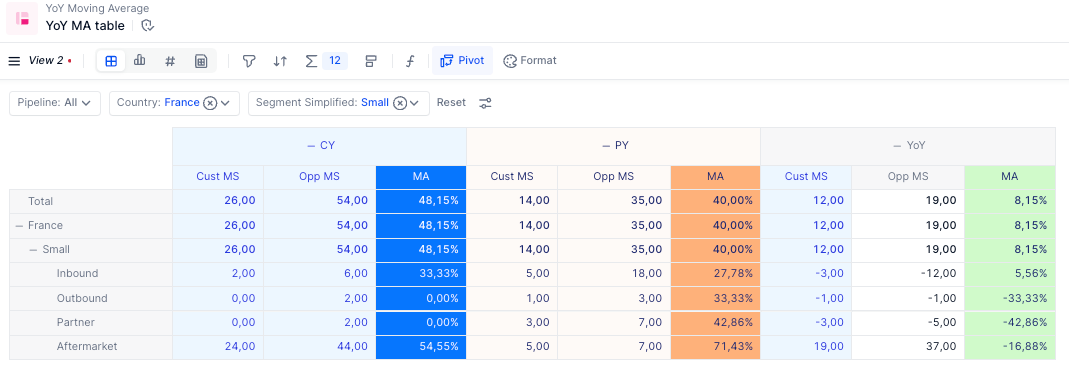
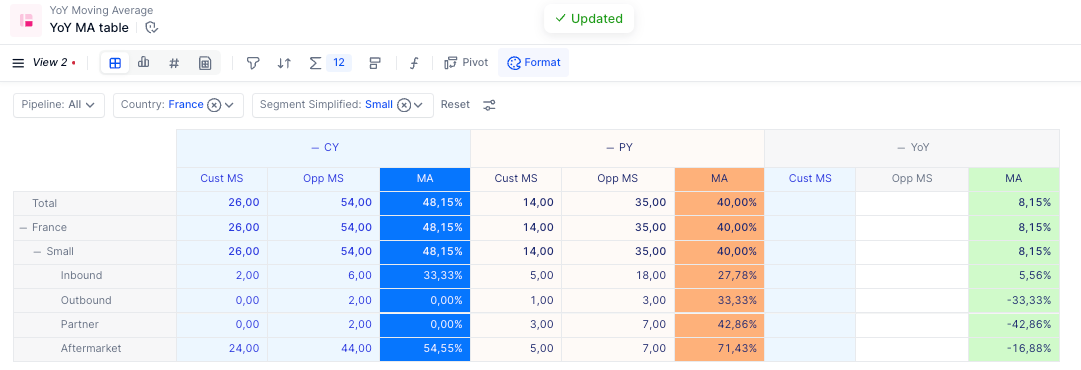
In this table I have included my base data required for my calculation. I have my ‘CY Cust MS’ which is the moving sum of a set period based on a variable ‘moving average’. ‘CY MA’ was calculated using the ‘show value as’ function where I duplicated my ‘CY Cust MS’ and then showed the value as a % of ‘CY Opp MS’. The same steps were carried out for ‘PY MA’ using its respective values. The issue I am having is that I want to now use my ‘CY MA’ and ‘PY MA’ to calculate my ‘YoY MA’, which I would calculate by doing: [ ( CY MA - PY MA) * 100 ]. By doing this I would be able to calculate my YoY MA and ensure that my total values would be the actual calculation, rather than an aggregation of the granular values. The problem is that I cannot reference ‘CY MA’ and ‘PY MA’ because there were calculated using ‘show value as’. What then would be a better alternative to calculate my values so that I can have the correct total values?
More info
- ‘Moving Sum”(MS) = sums data from a chosen period, makes use of ‘Moving average’ variable
- ‘Moving Average’(MA) = references a variable that sets the size of the moving average (insures both models have same calculation)
- Filter[month.end date...] = lets me filter for only the data I want
- switchover date, -2 = lets me set that values are being calculated for same period (can be confident values should be the same when testing)
Thank you in advance for your expertise and assistance!
-Darious
Best answer by Issam Moalla
View original