


Definition and examples
Tables are groups of Metrics that may be analyzed and compared together. It is composed of at least one Metric and uses at least one Dimension. Metrics in a Table may not have the same Dimension, so the Table handles allocation/aggregation.
Examples of Tables:
-
P&L: multiple Metrics like Revenue, Cost, Margin, and similar.
-
Project Costs: multiple types of Metrics: hardware, staff, travel and similar.
Creating a new Table
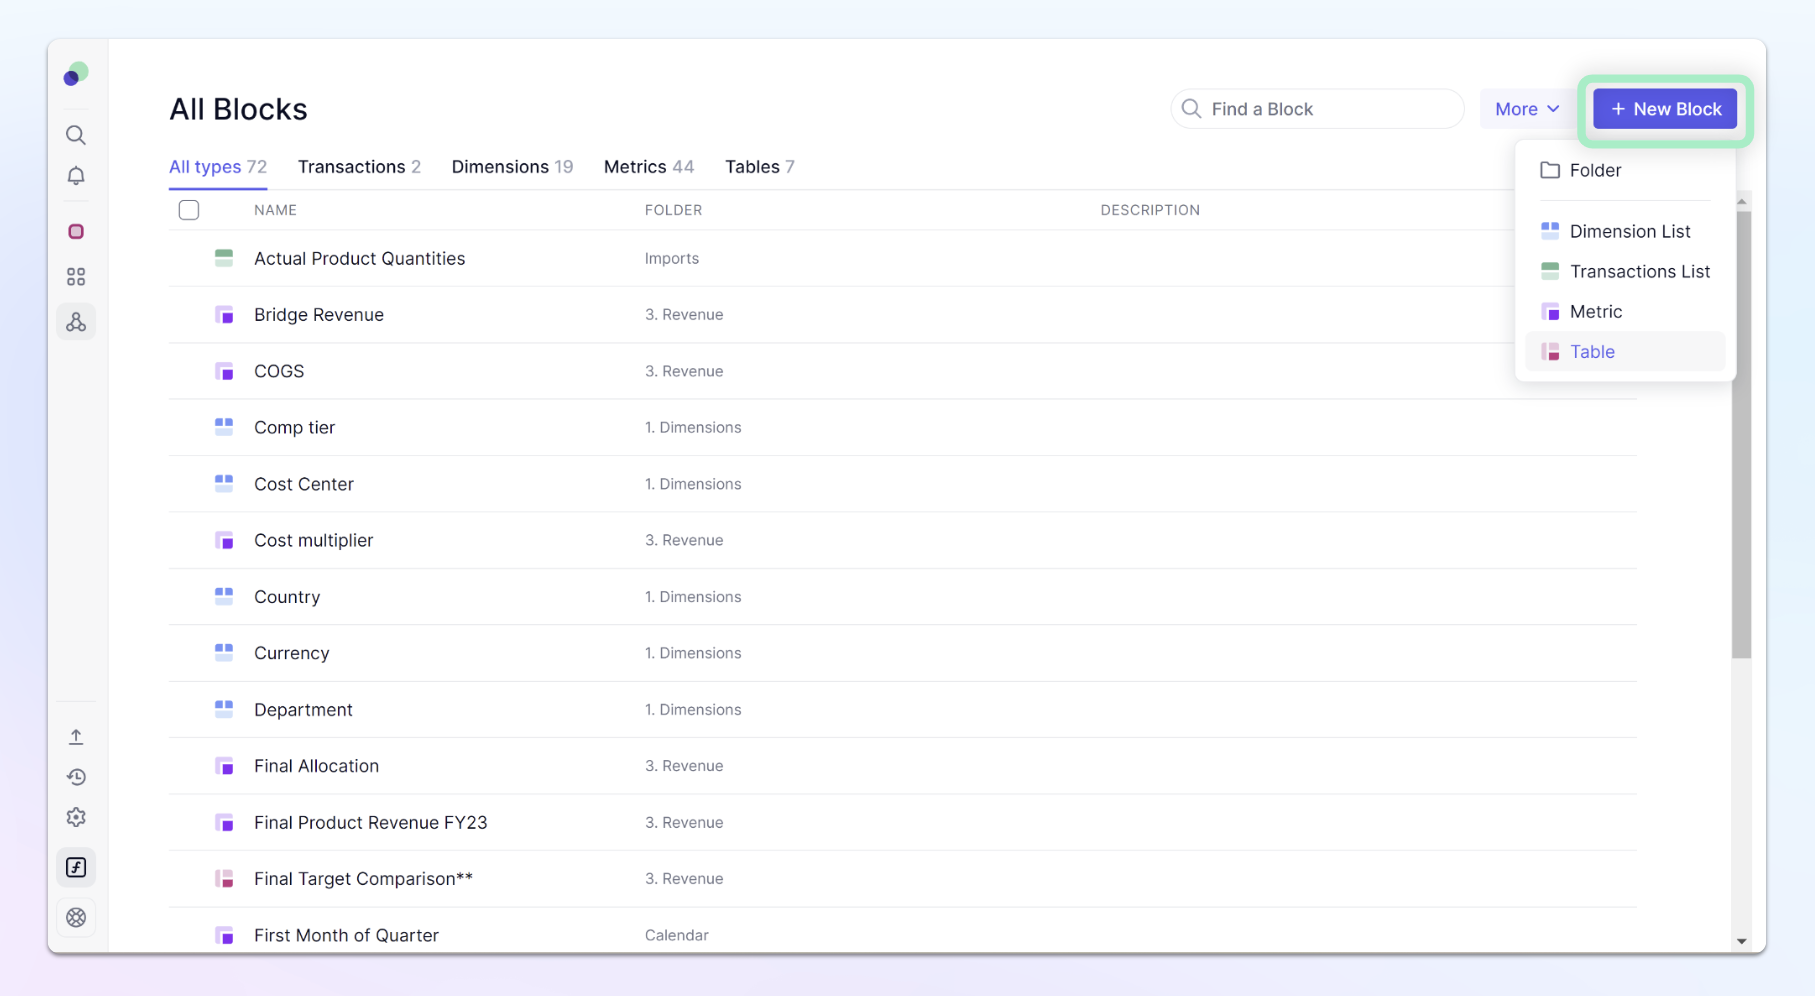
To create a new Table go to the All Block section in the sidebar of the Application and click on +New and select Table.
Adding Metrics to a Table
| When creating a Table, choose the Metrics you want to be displayed in this table. It is recommended to use Metrics multiple dimensions in common for easier display. | 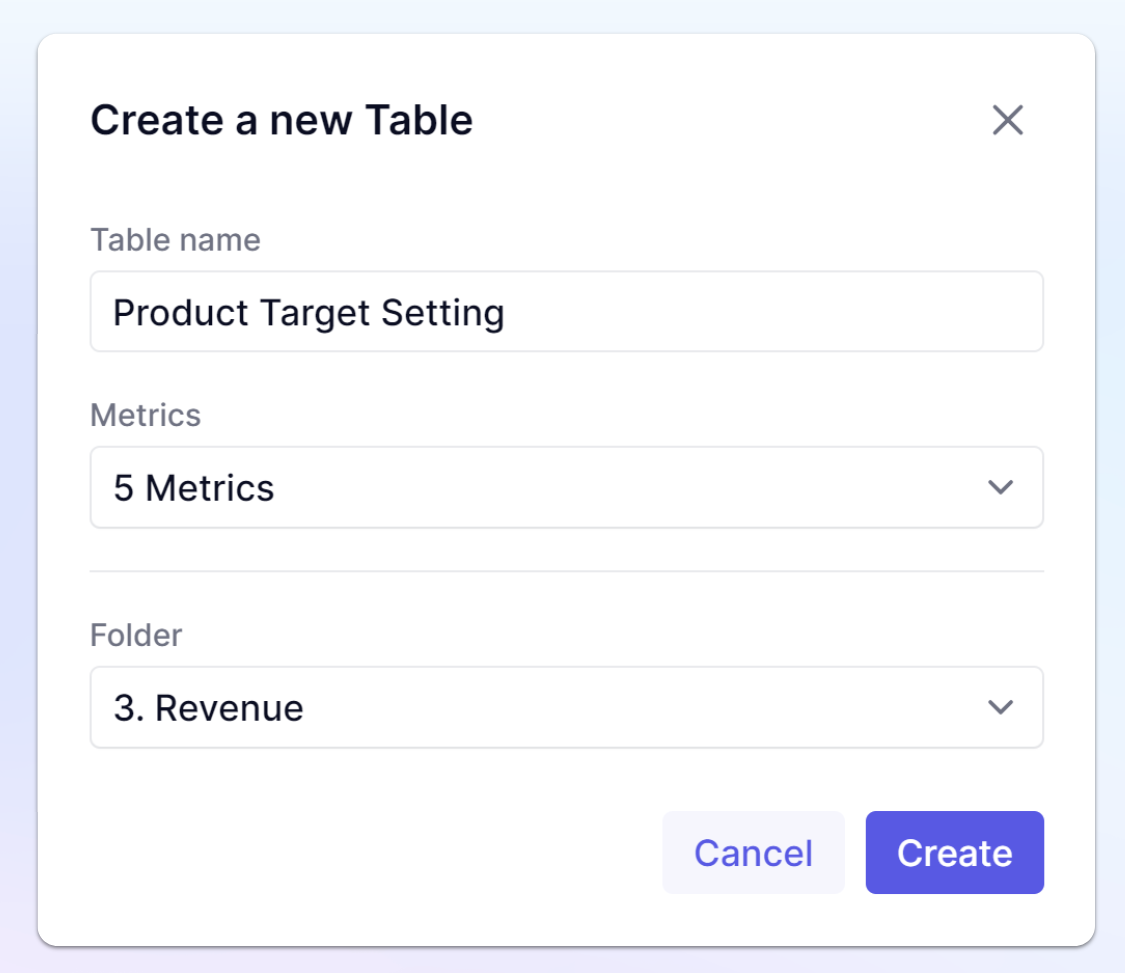 |
What you can do with a Table -
-
Switch easily between a grid, chart and sheet view using the display icons in the top left.
-
Export your data by clicking on the file icon
See also
Measuring what you want with Metrics