


Boards are the User Interfaces that are created for Members to interact with their data. This article shows how to create a new Board and the different type of Widgets that can be displayed on a Board.
Members must have the “Can configure” Board permission to be able to create or modify Boards.
Board options
When you create a Board, you can provide a title, subtitle, icon, and color. The color you select determines the appearance of the tile or list item when viewed in the All Boards or within a folder.
By enabling the options to display an icon next to the title and to use color in the header, you can showcase the chosen color and icon in the header of the board. You can also add a logo to the Board header.
Please note that the color palette available for selection is specially curated for board icons and is not editable.
Icons are valuable in aiding the identification of a board's purpose. These icons will be visible on the board's tile or list item, whether the board is inside a folder or in the "All Boards" section. Additionally, they will appear in the sidebar alongside the board's name. You can also add a logo to your Board header for further customization.
Adjust Board options
You can edit the folder, icon, subtitle, and color by accessing the ellipsis (...) menu next to a board on the sidebar. The same menu can also be accessed directly from the board's tile or list item. You can also display a color, icon, or logo on the Board's header.
To set a color, icon, or logo for the Board:
- Click Edit on the Board you wish to modify.
- Select the Format button.
- Use Set icon to set an icon for the Board. The icon will appear on the Board header, list, sidebar, and gallery.
- Use Header image to toggle an Icon or Logo to On for the Board header. Your logo will only appear on the Board header.
Go to Logo, Colors & Images in Workspace Settings to upload or update your logo.
Create a Board
To create a Board, first, open an Application. You will automatically land on the “All Board" section.
- Click the Button "+ New Board" on the right.
- Enter a Board name
- Choose a Color and Icon
- Add an optional subtitle for more context.
- Assign a Folder
- Click Create and configure
Organize Boards with Folders
Boards are organized into Folders. When a Board is added to a folder, it will appear under that folder in the sidebar, you can also click on a folder in the sidebar and it will show you all of your Boards. Boards will be displayed in either tile or list view depending on your selection. When creating a Board, you can also create a new folder by typing the name of the new folder and clicking the option to + Create the new folder.
Members must have “Create & Delete Folders” permission to be able to create new folders.
Add Widgets
Boards are made up of widgets. There are 6 different types of widgets. Grid, Chart, List, KPI, Text, and Button. Grid, KPI, and Chart are all used to display data from Metrics and Tables. Lists allow you to display Transactions or Dimension Lists on a Board. Text is used to create Titles, instructions, and other text to provide context for a Board.
Text
Text widgets can be used to add instructions or context to a Board. After Adding a text widget, you can drag and drop the edges to determine the size of your text box. The enter key will provide line breaks and you can highlight text to provide different heading sizes, Bold, Italics and Underlined options. You can also highlight text to provide links.
Charts
When working with Charts, Pigment has several different types; Bar, Line, Waterfall, Pie, and Combined. Check out this “Getting started with Charts” article for more information.
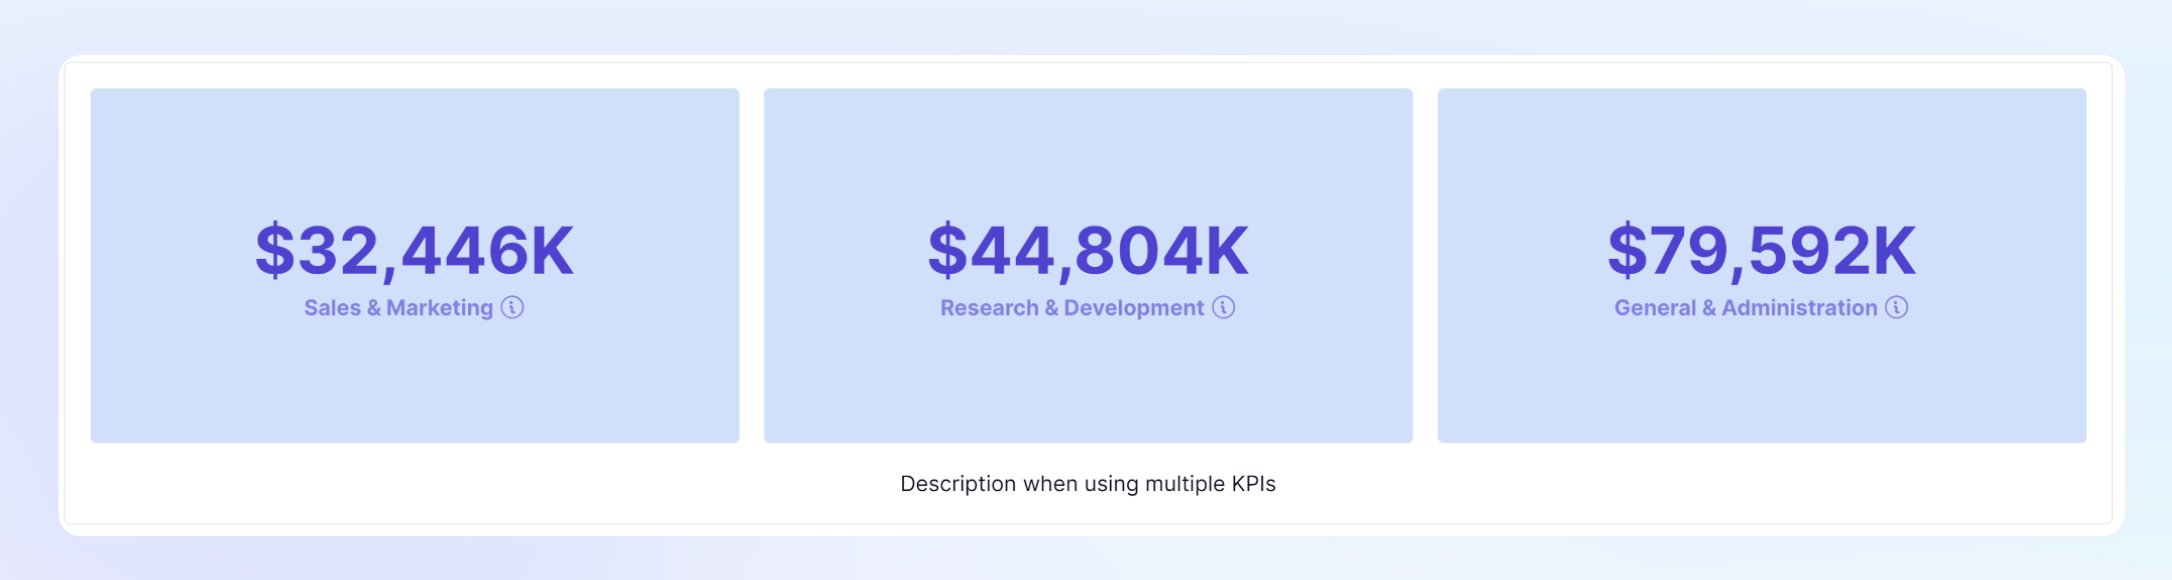
KPI
KPI or Key Performance Indicators are a great way to highlight important data points. Pigment KPIs can include a description, conditional formatting and can be set up to include up to 12 data points in one KPI.
Action Buttons
Action buttons can be configured for navigation to other Boards, Include external links, or trigger an import.
Grids
Grids are made up of Tables or Metrics to allow Members to view their data. They can be used to input data, view calculations or see reporting output after analysis. Within Grids, you can set up the grid in Sheet View which displays a Table or Metric in a familiar spreadsheet format for users to perform side ad-hoc calculations on.
Lists
You can publish Transaction and Dimension lists to a Board. These can be published as a widget for Members to be able to add items to a list from a Board. They can also be used to summarize data or used with filters for a Data validation board.
Images
Add images to your Boards with the Image widget. Image widgets can be used to add logos or other images to a Board.
Check out the course in the Academy on When to Use the Different Types of Widgets on a Board!
Interact with a Board
After a Board is complete, you can follow these steps to grant access to Members to the Board. Depending on the permission you grant them, they can comment and Interact with widgets in these ways.
Duplicate Boards
Duplicating Boards is an efficient way to simplify the creation of new Boards, particularly when two Boards that share similar structures or configurations. While maintaining separate Boards can be more work, but it often helps usability by delivering targeted information to specific audiences.
Duplicated Boards are useful for:
- Reusing elements like navigation buttons, images, and text widgets with standardized formatting. This is especially useful when these components are consistent across multiple Boards.
- Preserving intricate selector setups, such as hidden selectors or those relying on Application Variables.
- Adapting Boards to suit distinct needs:
- Adjust for regional or language-specific requirements.
- Provide specific indicators for different business units, for example, software and hardware teams.
To duplicate a Board:
- Click the menu (…) beside the Board name.
- Click Duplicate.
- Clean up unnecessary widgets for your new use case.
See also
Measuring what you need with Metrics

